The expected fall in the price of bitcoin on strong momentum after the breakout of the support at a dynamic level of $3340.
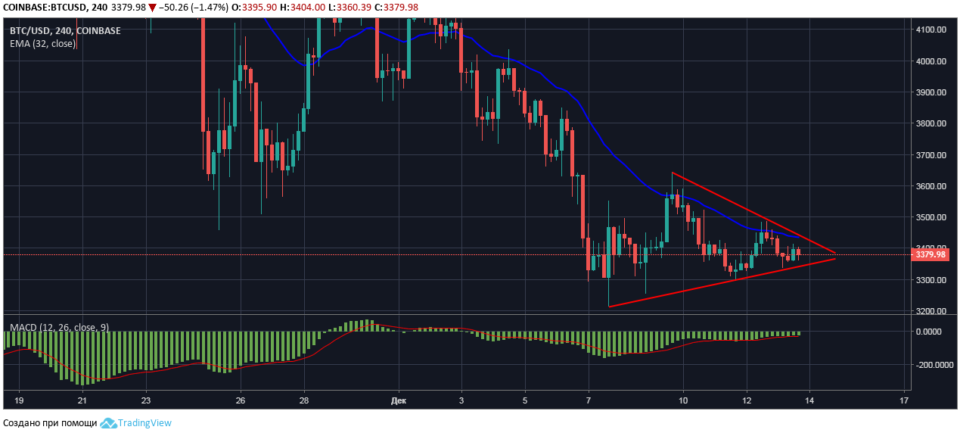
The four-hour chart of BTC/USD
At the time of market analysis bitcoin to US dollar is trading in a narrowing range $3380. During mid-day trading BTC/USD was under increasing pressure.
It should be noted that the moving average EMA30 is putting pressure on a currency pair increases the resistance of the upper border of the symmetrical triangle and indicates the downtrend of bitcoin in the short term.

Reduction signals that reinforce a hidden bearish divergence on the four-hour chart of BTC/USD with the MACD indicator.
Given the preponderance of signals on the price drop of bitcoin, it is assumed that from the graphical formation of “symmetrical triangle” its output will be on a strong momentum with a decline at least to $3290.
.