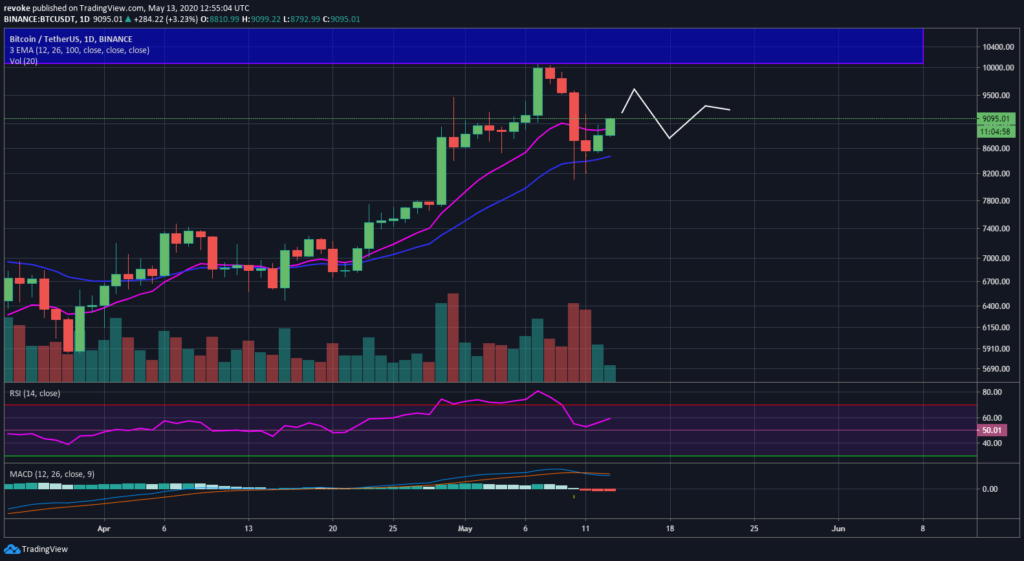
Although there was a lot of volatility the days before the halving, Bitcoin was pretty stagnant on the day of the halving and kept trading sideways. After creating a nice hourly uptrend, the bulls have managed to break above $9,000 just one hour ago.
Bitcoin is now trying to break $9,100 and eying up the last high of $9,168. Bulls are seeing increasing bull volume and would like to see a sustained move up to $9,200 to be confident in the last breakout.
The daily chart continues marching towards an equilibrium pattern. The most likely scenario will be a lower high at around $9,500-9,700 and then a higher low compared to $8,117. The higher the low is, the better chances the bulls have to see a breakout.

The chart above illustrates the possible equilibrium pattern scenario.
Bitcoin Long Term Outlook
We know Bitcoin’s halving is not likely going to affect Bitcoin anymore in the short-term, however, history has shown us that halvings have a huge effect on Bitcoin a few months after their completion.
Looking at the weekly chart, we can clearly see that Bitcoin is now extremely bullish although the last week bulls saw a nasty rejection from a key resistance area. However, it seems that the bears haven’t been able to take advantage of it.
The EMAs are still looking for a bull cross, possibly the next week and the bulls are trying to stay above $9,000. The weekly trading volume was increasing for the past 2 weeks and we might see a similar volume this week.
Either way, the bulls are extremely confident as they have a ton of space to work with even if they get rejected heavily from a resistance point. The last low is set at around $3,800 so anything above that level is a higher low. The bulls can easily set a lower high followed by a higher low into a higher high to confirm a weekly uptrend.
Similarly, the monthly chart is favoring the bulls which are trading above both EMAs that have remained bullish for years now. The clear resistance level for the bulls is $10,500. If they can manage to break and close above this level, Bitcoin can easily run up to $20,000 again.
The MACD is also looking for a bull cross on the monthly chart and the RSI is close to the midpoint at 55 points.

