Before the end of this week, the bears will attempt to absorb the volume buyers of bitcoin in the range of $3550-3480. Breakdown support open to the fall of the pair BTC/USD to the area prices of $3400.
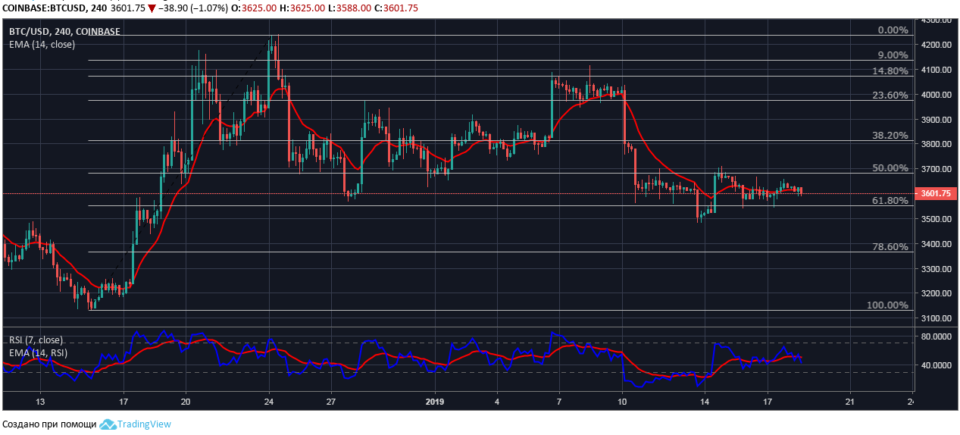
The four-hour chart of BTC/USD
At the time of the market review bitcoin is trading at $3602 with lower quotations from a session’s high price at $3645. During today’s trading pair BTC/USD bears the advantage was undeniable even on the background of minimal price volatility.
Current quotes of the pair are under pressure of moving average EMA14 with the value currently – $3617. The increase in sales activity over the last four hours indicates the willingness of the bears to test support prices locally of $3580.

Data of the relative strength index confirm the short-term lowering signals, the indicator value again in the field of sales, the RSI line is pointing down to the border of the oversold area.
Earlier, on 13 January, the bulls have already confirmed the presence of large amounts of bitcoin for purchases below the level of the price correction of 61.8%-$3550. It is assumed that bears will be able to develop short-term downtrend, only consume the volume buyers of cryptocurrencies in the range of $3550-3480.
.

