Bulls in the bitcoin market to hold the price above the local support level of $3820 and consolidate volumes to test the resistance of sales in the range of $3880-3900.
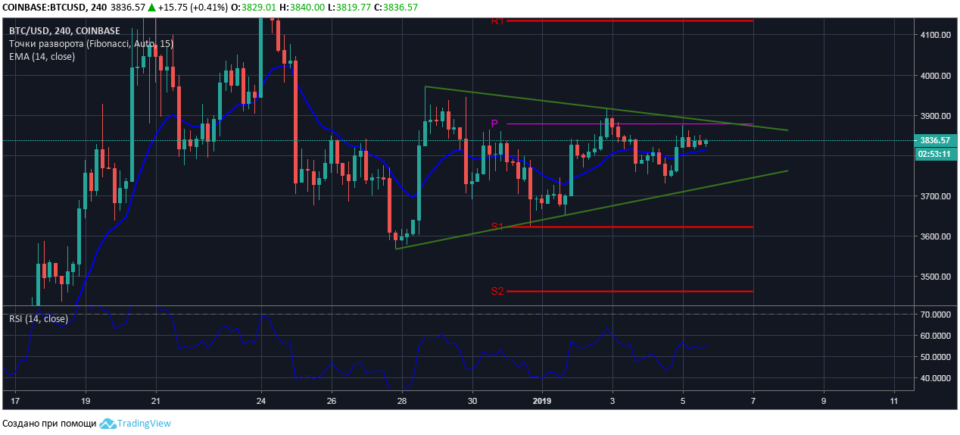
The four-hour chart of BTC/USD
At the time of market analysis bitcoin to US dollar traded at $3840. Since its opening day, the bulls keep the price of cryptocurrency on the local support level of $3820. A session high of BTC/USD was fixed at $3874.

The price movement data and technical indicators point to the likelihood that the bulls will test the resistance of sales at the upper boundary of the symmetrical triangle and at $3890 to the end of the current session.
Values of relative strength index held steadily in the line RSI14 is pointing up. The current price supported by moving average EMA14 with the value currently – $3815.
.