During the current session, the price of ethereum tested resistance at a key level of $ 122.00.
Four hour ETH / USD chart
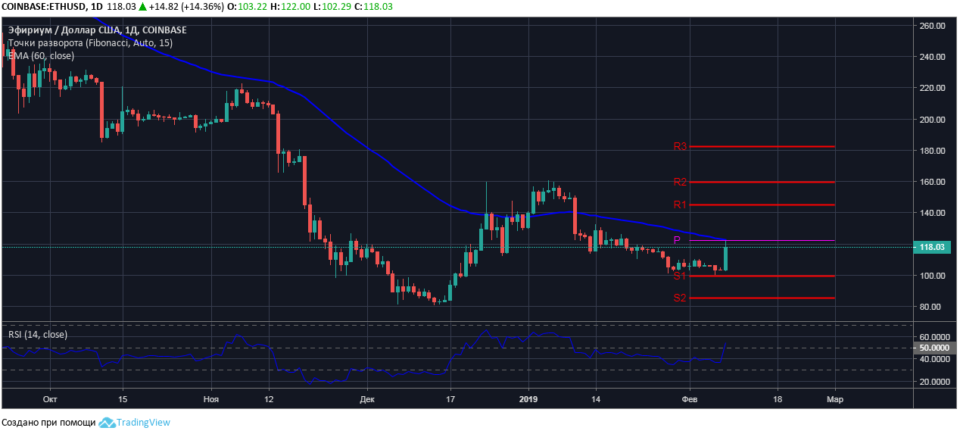
At the time of the market review, ethereum is trading at $ 118.00 with an increase of + 14.36% against the opening price of $ 103.22. The session price maximum is fixed at $ 122.00, at the level of a mid-term trend reversal.
The pivot resistance is enhanced by the moving average EMA60 with a current value of $ 122.90. The bulls could not break the resistance of sales at the reversal level. Against the background of profit taking on a significant part of the long short-term positions, the quotes of the ETH / USD pair are rolling away from the resistance level.

The data of technical indicators indicate the advantage of buyers: the value of RSI14 is in the field of sales, the indicator line is directed upwards. Given the nature of the price movement and short-term bullish signals, we believe that the ethereum will be adjusted in a narrow range of $ 119.00-114.00.
.