At the current week's bidding, the growth rate for the largest altcoins is set by the LTC / USD pair.
XRP / USD
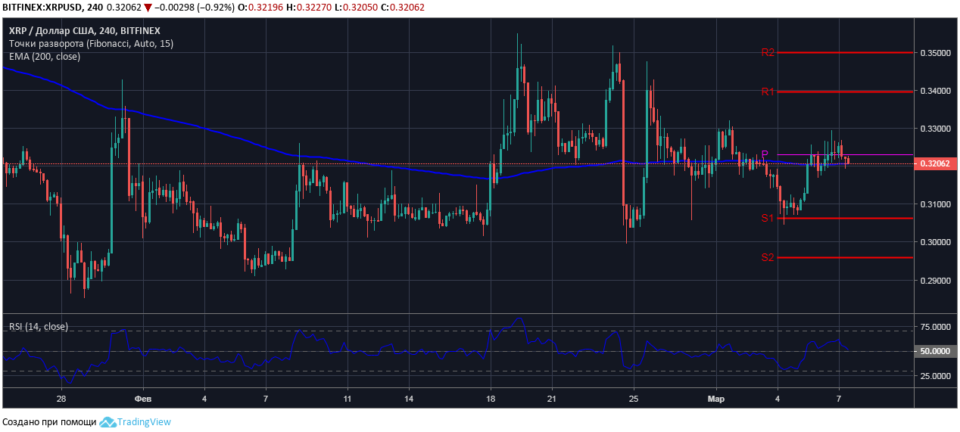
Today, at 17:30 Moscow time, Ripple was quoted at $ 0.3206 at the dynamic support level, which is formed by bulls along the EMA200 moving average line.
Analysis of the short-term rate of the XRP / USD pair for March 5-7 shows that above the weekly pivot of $ 0.3230 bears consolidate large volumes for the sale of a cryptoactive asset. During the current trading, sellers managed to push the bulls below the trend reversal level.
In the event of a breakdown in support of the Ripple price, sellers will open up scope for achieving immediate goals at a local technical support level of $ 0.3142.

However, the priority remains the expectations of a bullish scenario of the development of the trading situation in the short-term coin market, since the values of the relative strength index are consistently maintained in the area of purchases, the RSI14 line tends to turn up from the neutral level. In the coming hours, we should expect new testing of resistance at pivot level by buyers.
Graphical analysis confirms the formation of the “inverted head and shoulders” pattern with a target level of $ 0.3500. The signal for the start of testing the pattern will be a breakdown of the neckline in the price range of $ 0.3265, a confirmation of the breakdown will be the output of the XRP / USD pair above $ 0.3300.
BCH / USD
After recovering from March lows, at the second key support level of $ 122.50, the price of Bitcoin Cash is held mainly above the level of the reversal of the short-term trend of $ 130.60.
It should be noted that support for the price of cryptocurrency at the pivot level is enhanced by the moving average EMA200 with the current value on the scale of the H4 chart – $ 130.40.
At the time of the market review, the BCH / USD pair is trading at $ 129.90 with a decrease in quotations from the session high of $ 132.75. Buyers have generated temporary support at the local level of $ 129.50.

Bulls retain the potential to develop a short-term uptrend. The critical level of support is at $ 128.00, and only breaking it down will give the bears room for movement to the key level of $ 125.60, at which the price will be completely under their control.
The current values of the relative strength index are held above the neutral level on the indicator chart, the RSI14 line tends to turn upwards, which implies an increase in the volume of purchases of Bitcoin Cash in the short term and the recovery of the price above the trend rotation level.
LTC / USD
Over the past three days, relative to the March low of $ 45.75, the maximum increase in the price of litecoin was 29.40%. At the time of the market review, bulls are testing sales resistance at the second key resistance level with a value on the daily LTC / USD chart – $ 58.77. On a false breakdown of the designated level, the price of a cryptoactive asset recorded a session high of $ 59.37.
It should be noted that during the current session, the pair overcame the five-month resistance level at $ 57.00 and the medium-term trend of cryptocurrency is classified as ascending.

The data of technical indicators confirm the advantage of bulls in the medium-term trading period: the relative strength index values are high in the buying area, the RSI14 line is directed upwards at the border of the overbought area.
From the daily LTC / USD chart, it is obvious that for the further development of the uptrend it is necessary for buyers to consolidate above the key resistance level of $ 58.77 in the short term.
Trading recommendations are not a guide to action. Following the recommendations, you assume the associated risk of loss of funds.
.

