At the current trading session, bears are testing key levels of price support for the largest altcoins.
XRP / USD
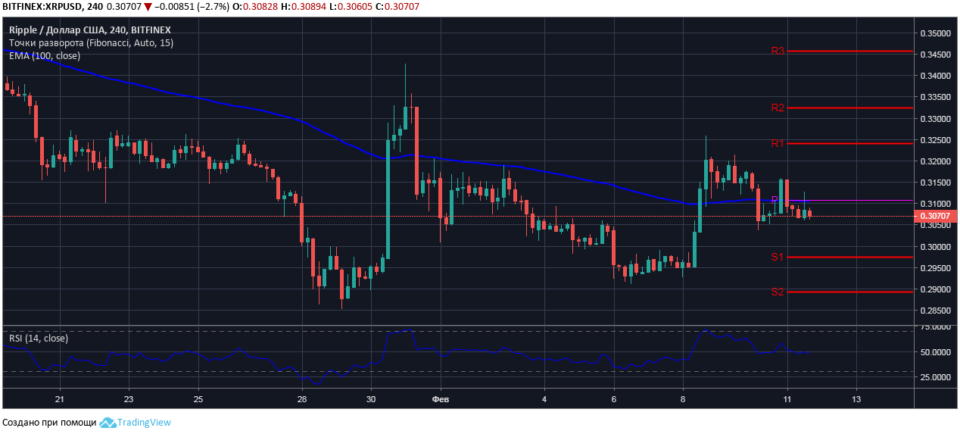
At the time of the market review, Ripple is trading at $ 0.3070 above the local support level of $ 0.3050. The moving average EMA100 puts pressure on the current cryptocurrency price. At the same time, the EMA100 boosts sales resistance at the reversal level of the $ 0.3110 short-term trend.
At the opening of the European trading period, the bulls made an unsuccessful attempt to break through the designated level, the testing level only confirmed the consolidation of large volumes of Ripple sales above $ 0.3110.

The value of the relative strength index is at a neutral level, the RSI14 indicator line is horizontally directed, which indicates the uncertainty in the mood of the parties in the bidding for the XRP / USD pair.
Graphical analysis confirms the formation of a “double bottom” pattern with a resistance level at a session high of $ 0.3155. Theoretically, in the case of the market working out in the short term, the price pattern bulls will seek to reach the target level of $ 0.3255.
BCH / USD
At the time of the market review, Bitcoin Cash is quoted at $ 119.30. The pair BCH / USD since the opening of the auction is reduced from a session high of $ 126.00. The instrument quotes broke through the support at the short-term trend reversal level of $ 122.30 and at the dynamic level along the EMA100 moving average line in the $ 120.50 price area.
It is expected that support for the price of Bitcoin Cash bulls will form in the range of $ 119.00-117.00. In the event of a breakdown of support in the designated range, sellers will easily reach their immediate goals at the first key support level of $ 114.20.

To maintain the growth potential of the BCH / USD pair, bulls need to consolidate above the pivot $ 122.30. Closing the current four-hour candle below the moving average EMA100 will dramatically reduce the chances of the bulls to regain control over the price above the reversal level.
LTC / USD
The session maximum of the litecoin price is fixed at $ 47.65, where, under the influence of fixing large volumes of long speculative positions, the bulls lost the initiative and the price was rejected below the opening mark of $ 47.60.
At the time of the review, the LTC / USD pair is quoted at $ 43.19. Bears are testing support at the short-term trend reversal level of $ 43.00. In case of a breakdown of the level, the price reduction may reach a mark at the local support level of $ 39.80 and below, at the first key support level of $ 36.90.

However, the developed bullish divergence on the four-hour LTC / USD chart with the RSI14 indicator indicates strong support for the price at the pivot level. There is a possibility that bulls will protect the indicated level and at least the price will continue moving horizontally above $ 43.00 until the end of the current session.
TRX / USD
At the time of market analysis, Tron is trading at $ 0.0250. The inability of bulls to overcome the resistance of sales at a dynamic level, formed on the line of the moving average EMA100 with a value of $ 0.0265, attracted new sellers to the cryptocurrency market.
A pair of TRX / USD with a strong downward momentum broke through the first key support level of $ 0.0254 and reached the mark of $ 0.0244. The price rebound from the S2 level indicates the interest of market players in the coin on the price reduction to the boundary levels of support.

However, if the buyers of altcoin before the end of the trading day fails to consolidate above $ 0.0254, the sellers will increase the pressure and make a new attempt to break the price support. In the case of the development of a bearish scenario at the trades on the TRX / USD pair, on February 12 the price reduction will reach the mark of $ 0.0240 at the local support level.
Trading recommendations are not a guide to action. Following the recommendations, you assume the associated risk of loss of funds.
.

