Until the end of the current session, the bulls can update the local maximum of the ethereum price at $ 122.00.
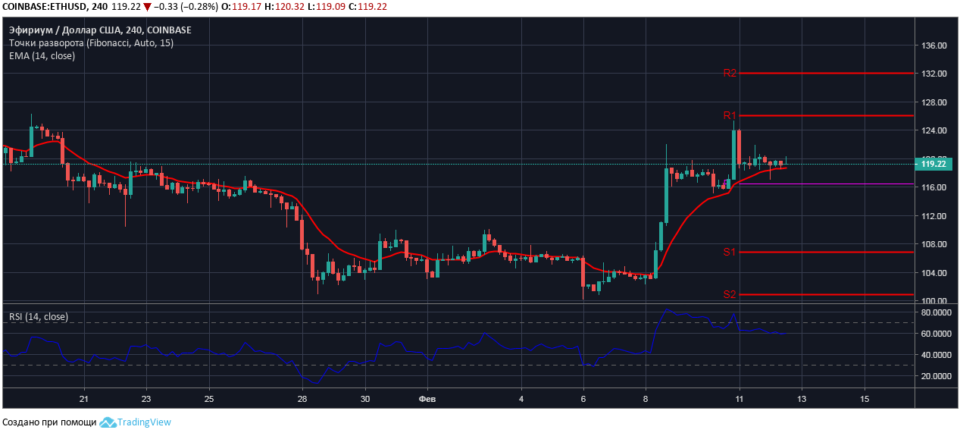
Four hour ETH / USD chart
At the time of the market review, ethereum is trading at $ 119.20, above the short-term trend reversal level of $ 116.50. Support for the pair ETH / USD bulls form the ascending line of the moving average EMA14 with the current value of $ 118.60.
The value of the relative strength index is consistently held high in sales, which confirms the advantage of buyers in the short-term market Ethereum. The RSI14 line tends to turn upwards from level 60 on the indicator chart, the probability of growth of instrument quotes is enhanced by the formed bullish divergence.

The current level of the etirium price seems to be a good point to enter the market with short-term long positions. It is possible that at the February 13 coin auction, bulls will test sales resistance at a key level of $ 126.00.
.