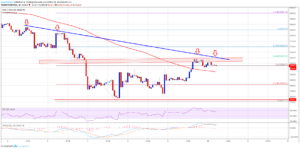
Bitcoin exchange rate began to recover and overcome resistance at $3,500. In the neighborhood of $3590 resistance is formed the downward trend line (hourly chart the pair BTC/USD).
The dynamics of the course
The recent collapse of the cryptocurrency market ended with a bitcoin at $3350, which formed the strong support. In the beginning of the rebound was crossed the resistance line of $3400, $3500, and then 50% Fibonacci retracement from the last recession $3850-$3207. The closing took place above $3480 and simple moving average 100 hours.
Superior resistance
However, the $3600 and $3620 met the rise of bitcoin is strong resistance, and at $3590 was formed the resistance of the downward trend line (hourly chart the pair BTC/USD) as well as 61.8% Fibonacci retracement from the last recession $3850-$3207. Thus, the breakout line of $3600 is now the main task for the bulls, which depends on overcoming the key barrier of $3700 and the beginning of a short-term bullish trend. Initial resistance is in the neighborhood of $3480 and simple moving average 100 hours.

Performance review
Convergence/divergence (MACD) for the pair BTC/USD is back in bearish zone, while the relative strength index (RSI) is above 50, which creates a mixed situation.
The main support level of $3400 resistance is $$3605.

