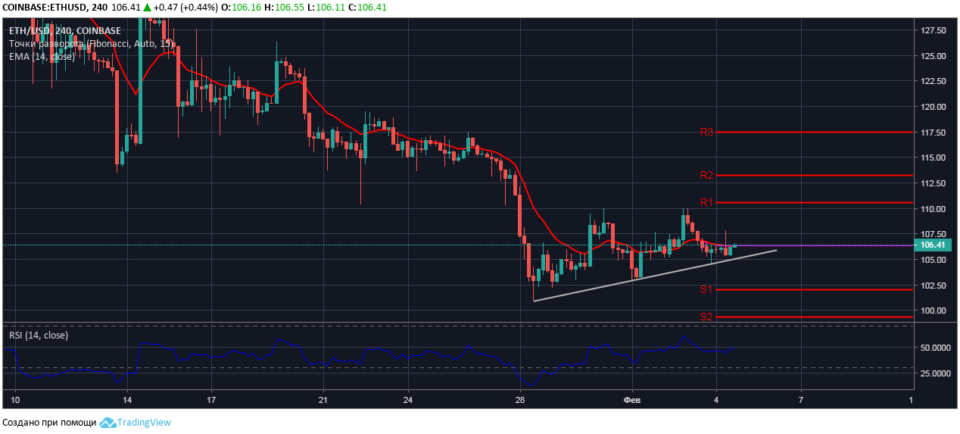
In the morning trading in ethereum on February 5, a short-term growth in the price of cryptocurrency is possible to the level of $ 110.60 at the first key resistance level
Four hour ETH / USD chart
For the four-hour chart of the ETH / USD pair, the key Fibonacci support-resistance levels for the period of February 4-10 are calculated:
- trend reversal level – $ 106.30;
- support levels – $ 102.00 / $ 99.40 / $ 95.10;
- resistance levels are $ 110.60 / $ 113.30 / $ 117.50.
Since February 3, the ethereum has been trading in a narrowing range with an upper limit at the reversal level of the short-term trend – $ 106.30. At the time of the market review, bulls are again testing sales resistance.

From a technical point of view, buyers have the opportunity to update the session maximum price at $ 107.85.
The current price is supported by the short moving average line EMA14, the value of the relative strength index is in the neutral area of the indicator chart, and the RSI14 line crosses the neutral level from bottom to top. The data of technical indicators confirm the raising signals for the short-term course of the pair ETH / USD.
.