
TL;DR
- Ethereum is holding a six-week upward trend while technical analysts detect patterns not seen since 2020.
- Indicators like the monthly stochastic RSI and MACD suggest an imminent cycle shift.
- On-chain data also reveals accumulation by large investors while retail interest remains low, potentially signaling a new surge for the entire crypto ecosystem.
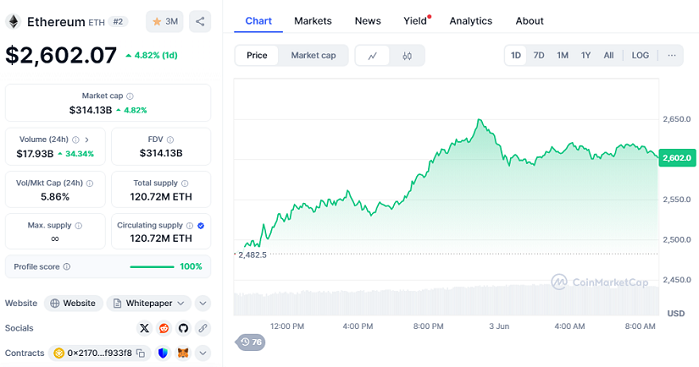
Ethereum is currently trading at $2,602.7, up 4.82% over the last 24 hours, with a market capitalization of $314.13 billion. But beyond the current price, what’s really catching analysts’ eyes is what’s happening beneath the surface: whales are returning to the market, and this time, the charts are sending a clear signal of structural change that could shape the coming months and influence altcoin behavior significantly.
Technical analyst Kevin (@Kev_Capital_TA) recently explained that Ethereum is forming a structure that has historically preceded major rallies. He points out that the monthly chart reveals a long-standing compression pattern, reminiscent of the quiet accumulation phase seen in early 2020. In April, Ethereum briefly dipped into the $1,400 range before closing the month with a powerful demand candle, a formation that has only appeared twice before (from 2017) and has always been followed by sustained upward momentum across key levels.
Technical Indicators Suggest Deeper Shifts Ahead
The monthly stochastic RSI is on the verge of making a “V-shaped” cross from oversold territory, similar to the one that marked the 2020 macro bottom. Meanwhile, the MACD histogram has been compressing for nearly four years, indicating pent-up energy waiting to be unleashed. On-chain money flow metrics—previously at historic lows—are now beginning to reverse, hinting at renewed confidence among large holders and quiet strategic positioning.
Quiet Accumulation Could Ignite Altcoins
Ethereum dominance is also showing signs of reversal, with green Heikin-Ashi candles printing for the first time in over a year. Kevin notes that this pattern closely resembles what unfolded ahead of the 2019–2021 bull cycle. Furthermore, the ETH/BTC ratio has just touched the 0.5 Fibonacci retracement level, flashing its own demand candles. Notably, the stochastic RSI for this pair has remained below the 20 threshold for almost three years, typically a sign of deep market exhaustion and an upcoming reversal.
Although ETH still faces strong resistance between $2,800 and $3,000, long-term indicators suggest that a bear market exit is underway. If confirmed, this won’t just boost Ethereum, it could signal the start of a broader rally across the entire crypto sector.