Bitcoin and Ethereum are the two top cryptocurrencies by market cap, making up the lion’s share of the total asset class market capitalization and having the most influence over the rest of the market.
The two major gatekeepers impacting the ebb and flow over all other cryptocurrencies are both coming to a critical moment in their market cycle, where either a new long-term uptrend will begin, or the downtrend these assets have been struggling to break free from will resume and even grow in severity.
To assist investors and traders with what to anticipate, PrimeXBT, an award-winning multi-asset trading platform, has prepared extensive technical analysis and fundamental research into each asset’s price action over the last several years, the health of each cryptocurrency’s underlying protocol, and any upcoming events that may impact the valuations of these highly speculative and wildly volatile digital assets.
Bitcoin (BTCUSD) Technical and Fundamental Analysis
Bitcoin price has been trapped under $10,000 for the better part of the bear market. More specifically, the asset has been trading within a range between $6,000 and $10,000 for more than 60% of the last two and a half years of downtrend.
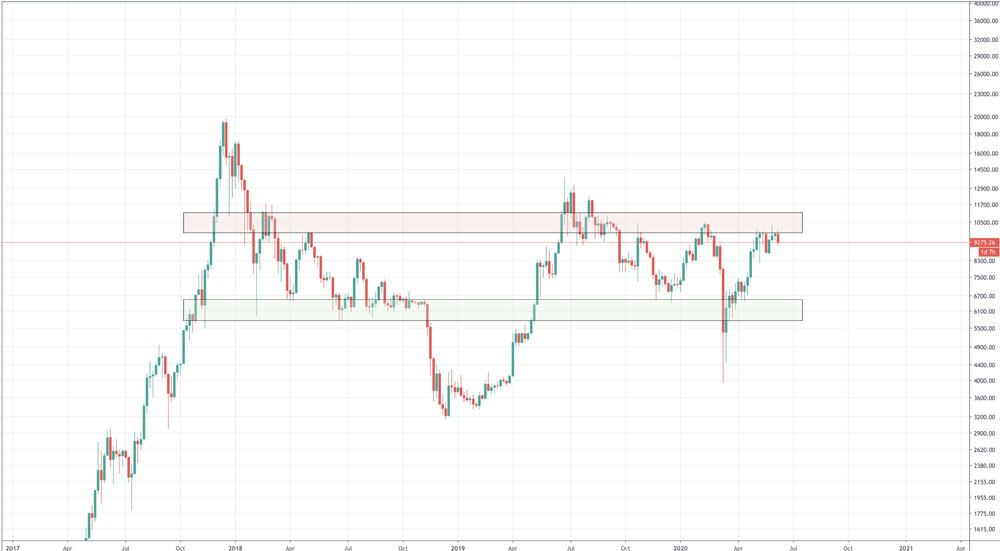
As pictured above, Bitcoin has made repeated attempts to break back above the key level but has failed several times. On daily timeframes, Bitcoin price has set a lower low and lower high, which is typically a bearish sign of a downtrend picking up in severity.
A new uptrend looked to be a strong possibility in early 2020, but market structure may have been broken in mid-March by the Black Thursday collapse.
On the highest timeframes, however, the Black Thursday drop in Bitcoin set a higher low and may be a signal of a powerful uptrend.
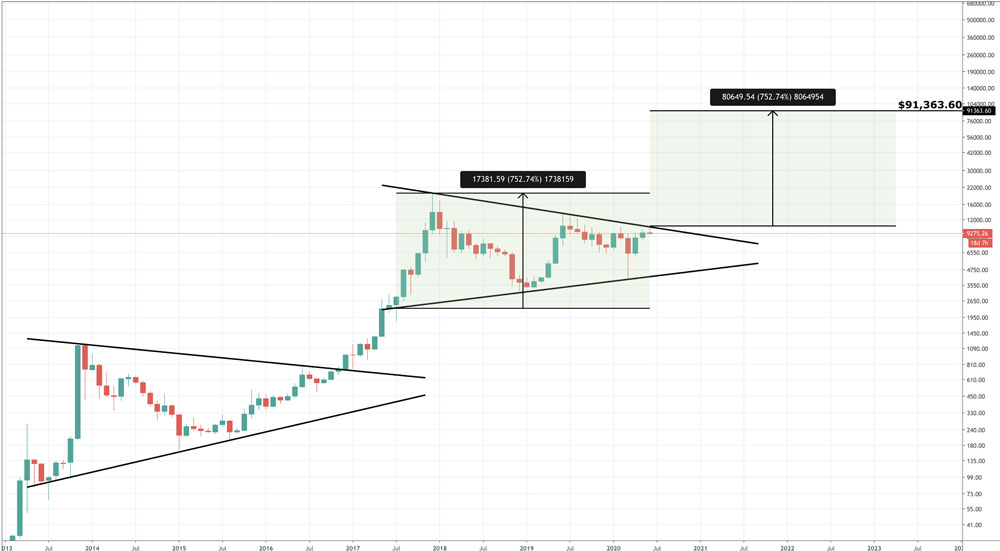
Zooming out, Bitcoin price has been trading within a symmetrical triangle, similar to the last bear market from 2014 through 2015. After Bitcoin broke out from the previous triangle, its valuation rose from under $1,000 to $20,000 per BTC.
Symmetrical triangle targets are measured by taking the widest point of the triangle and adding it to the breakout. A breakout from current levels would lead to a technical target of roughly $93,000 per BTC.
Fundamentally, Bitcoin is both healthier than ever, but also at risk of a severe drop due to that state of that health.
The asset’s halving has now come and gone, but the price per BTC has only traded sideways since. No new bull run breakout happened, nor did any post-even selloff.
Each halving thus far has kick-started a new uptrend for the first-ever cryptocurrency. And while that is expected this time around due to the way the asset’s built-in deflationary mechanism was designed, a severe selloff driven by capitulating miners may be required to cleanse the network of the weakest miners, and allow the strongest miners to thrive in profitably.
Profitable miners hold their Bitcoin instead of selling, causing demand to outweigh supply and prices to be marked up.
Specially designed fundamental analysis tools, however, point to miners struggling due to the current price of Bitcoin being lower than the cost of production.
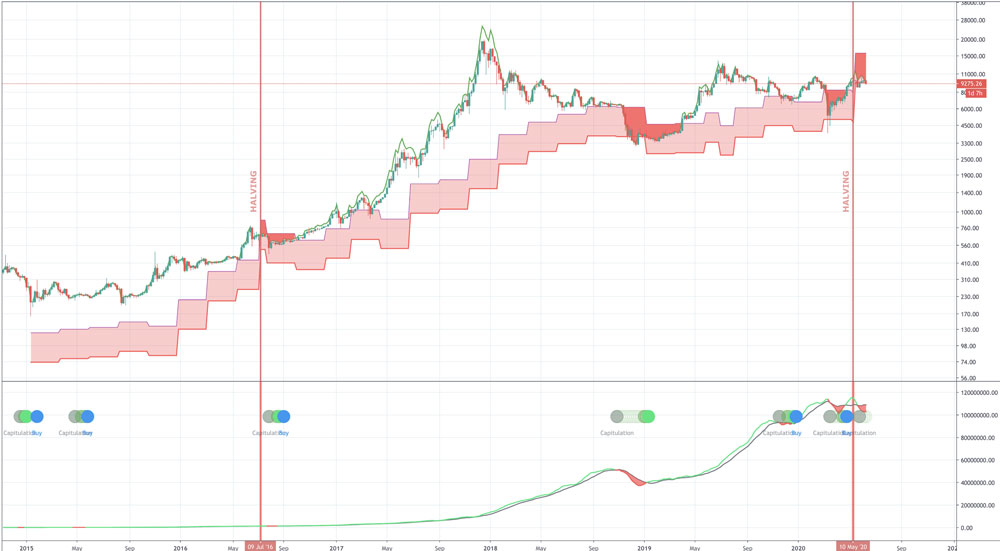
Hash ribbons, measuring the impact of miners on price action, shows that miners are selling as much Bitcoin as they did during the Black Thursday selloff, despite prices being 140% higher.
The asset’s halving also caused the cost of production to double for most miners, which is now significantly above the price per BTC. This could force the least profitable miners to sell all BTC holdings, and permanently shut down their machines.
This cleanses the network and allows Bitcoin’s next bull market to take root. However, it could result in a frightening selloff many crypto investors and traders aren’t prepared for before the uptrend begins.
Ethereum (ETHUSD) Technical and Fundamental Analysis
Like Bitcoin, Ethereum represents a large portion of the cryptocurrency market. Its valuation and health often dramatically influences that of other altcoins, many of which are built on top of the protocol as ERC20 tokens.
Also much like Bitcoin, Ethereum has been in a downtrend for more than two full years.
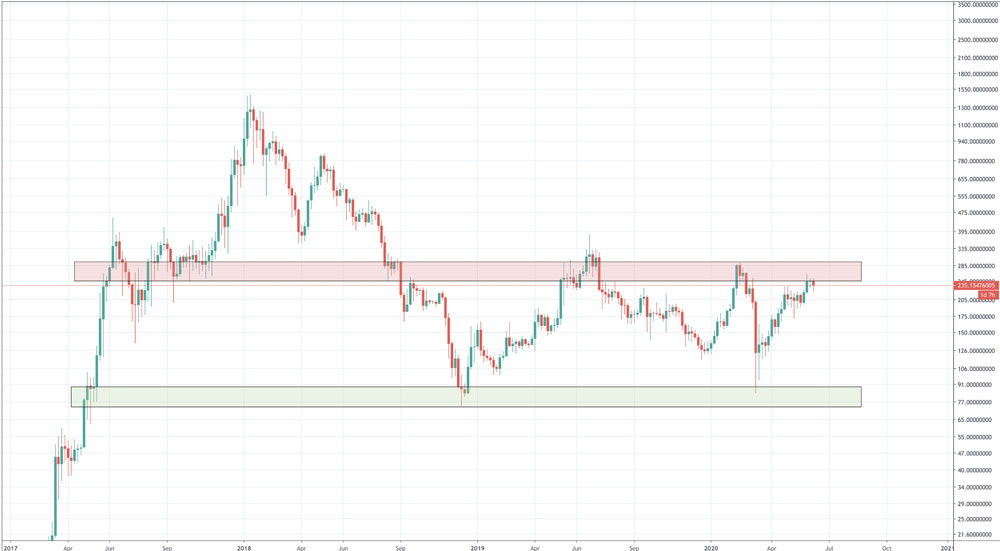
The asset has spent most of its time trading between roughly $80 and $250 per ETH token. After a drop from its all-time high, Ethereum fell by over 90%. The number two ranked crypto has recovered since, but nowhere as well as Bitcoin has.
Ethereum has been trading within a falling wedge pattern the entire time, that according to the top trend line, has seen a breakout, retest, and is now holding above the key line. Yet no strong reaction has happened to the lack of horizontal downtrend resistance.
Supporting the idea of a breakout, the MACD has had a bullish crossover, as well as the Stochastic indicator – two momentum and trend-following tools.
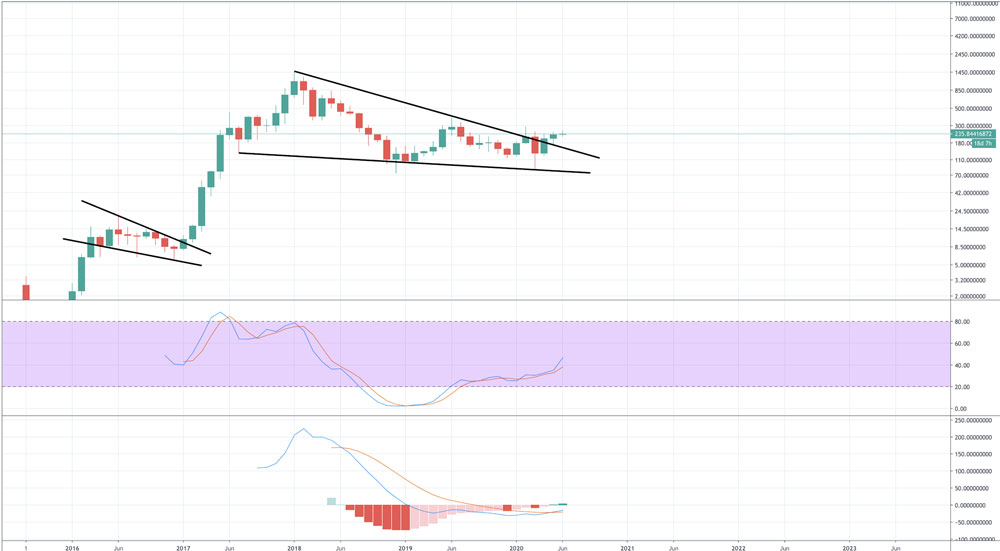
Targets of falling wedges are less clear, and given how young the speculative asset is, valuations could reach exuberant levels quickly, as is the case with any altcoin. Ethereum price predictions, however, offer valuations ranging from $3,500 to $35,000 per ETH.
Resistance at $250 continues to prove to be too strong for the asset to break above. The rapid growth in decentralized finance and the upcoming Ethereum 2.0 upgrade that enables staking have been thus far unable to provide the momentum needed.
A date for the ETH 2.0 upgrade continues to be shrouded in uncertainty and vagueness, which has been hurting price action. The 32 ETH requirement for staking, however, could sharply increase demand for Ethereum and cause prices to spike.
The largest challenge Ethereum faces, is the fact that speculative traders are overwhelmingly long on the asset. Contrarian traders would suggest that these investors are in for trouble being so overexposed in one direction.
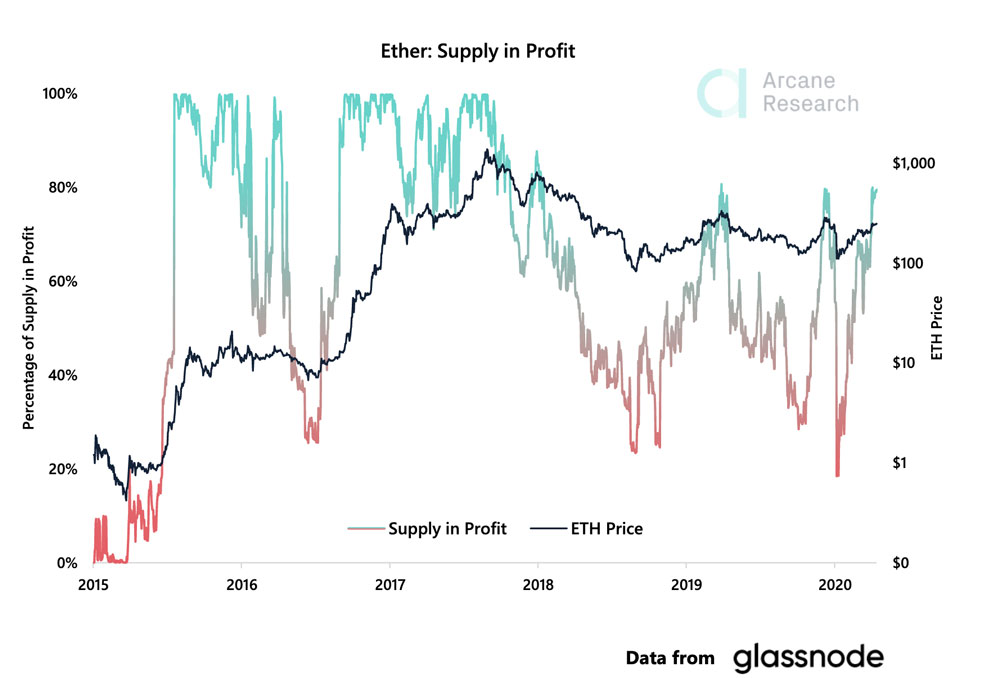
Making matters worse, holders of over 80% of the ETH supply are sitting in profit. Although the asset is still so far down from its all-time high, many early investors and even recent buyers are in strong profit.
If a selloff starts, profit-taking could kick in and cause a cascading effect.
Conclusion: Cryptocurrency Market At An Impasse, Decision Expected Soon
There’s no denying that bullish and bearish signals are abundant both in terms of Bitcoin and Ethereum’s price action, underlying health, and the events ahead that will impact each asset’s future.
Considering the sideways price action and consolidation leading to extreme lows in volatility in the normally highly volatile asset class, indicates that an explosive move is coming in one direction or the other.
Knowing the facts above and using the research supplied by PrimeXBT analysts, traders can prepare themselves for either scenario by watching for key levels to take action, set stop losses, or open a long or short trade.
Investors may suffer should cryptocurrencies see more downside, but would enjoy incredible performance if a new uptrend starts. Traders, however, can profit whichever direction the market turns.
PrimeXBT, an award-winning Bitcoin-based trading platform offering long and short positions on forex, stock indices, commodities, and cryptocurrencies like Bitcoin and Ethereum has all the tools necessary to take advantage of violent and volatile market swings in any direction.
A 60-second registration process and a low minimum deposit of just 0.001 BTC is needed to get started and get prepared for what’s to come.
Sources: PrimeXBT, TradingView, Arcane Research, Glassnode, Charles Edwards

