During the current session, a sharp decline in average daily trading volumes was noted in the largest altcoin markets.
XRP / USD
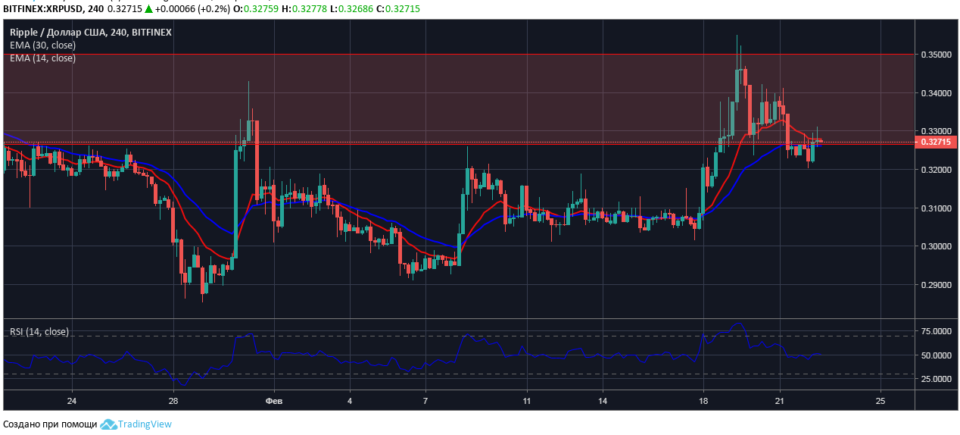
At the time of the market review, Ripple is trading at $ 0.3271. The XRP / USD pair is recovering above the support level of $ 0.3265 with the support on the horizontally directed line of the moving average EMA30 with the current value of $ 0.3260.
An analysis of the four-hour XRP / USD chart shows that to reduce the risks of price reduction, the bulls need to gain a foothold above the level of $ 0.3400.

The relative strength index data indicate a roughly equal balance of power between buyers and sellers: from February 21, the index values are kept at a neutral level, the RSI14 line is flat and directed horizontally.
The development of the Ripple rate in the short term will have a development in the Bitcoin and ethereum markets. Given the emerging market trends, there is a possibility that before the end of the trading week, the XRP / USD pair will trade with higher quotes.
BCH / USD
A pair of BCH / USD found support at a dynamic level with the current value of $ 138.60. At the time of review of the market, Bitcoin Cash is trading at $ 141.20. The cryptoactive is supported by the moving average EMA30.
The price is fixed above the short moving average line EMA14 with a value of $ 141.20, which indicates the situational advantage of the bulls in the short-term altcoin market.

The values of the relative strength index from February 17 are held in the area of purchases, the RSI14 line is directed horizontally for more than 24 hours, which indicates a decrease in trading activity of the parties.
Short-term purchases of BCH / USD are possible from the price level of $ 140.00 with targets of $ 143.70 and $ 146.00. To protect long positions should be orders no higher than the dynamic level of $ 138.60
LTC / USD
From the second half of the trading session on February 21, the price of lightcoin is moving in a narrow range of $ 49.00-51.00. The main support for the pair of LTC / USD bulls form on the line of the moving average EMA30 with the current value of $ 49.10.
Buyers of lightcoin have a slight advantage in the market, however, price support is not strong enough to break through the resistance of sales at the local level of $ 51.00.

The likely correction of the price of the lightcoin to the dynamic support level of $ 49.10 will provide day traders with the opportunity to enter the market with short-term long positions. The target levels for longs are $ 51.00 and $ 54.00.
Trading recommendations are not a guide to action. Following the recommendations, you assume the associated risk of loss of funds.
.

