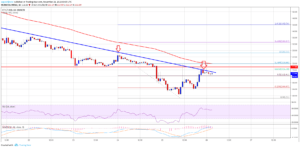
Course ETH slipped sharply and even for a few hours fell below $100. The resistance of the downward trend line was formed in the neighborhood of $116 on the hourly chart pair of ETH/USD.
The analysis of the dynamics of the course
Last week, the rate of the ETH broke the support line of $115 and $110 and then $100. Also was broken the support level 50% Fibonacci retracement from the last recession $126-$98. As a result, low was formed in the neighborhood of $98. Later took place the restorative correction, and at the time of writing the cost of one token Ethereum is $107.
However, at $118 bulls were waiting for a strong resistance (this level previously acted as support). Moreover, in the neighborhood of $116 resistance has formed the descending trend line (hourly chart pair of ETH/USD). If these barriers are overcome, we can expect a recovery towards $125-126.
 In case of failure of the bulls, ETH may again be below $100, or even $95.
Performance review
Convergence/divergence (MACD) for a pair of ETH/USD is now in bullish zone. The relative strength index (RSI) is above 50.
The main support level of $100, resistance at $118.

