These technical indicators point to the possibility of a long flat pair of ETH/USD in the range of $130,00-120,00.
The four-hour chart the ETH/USD
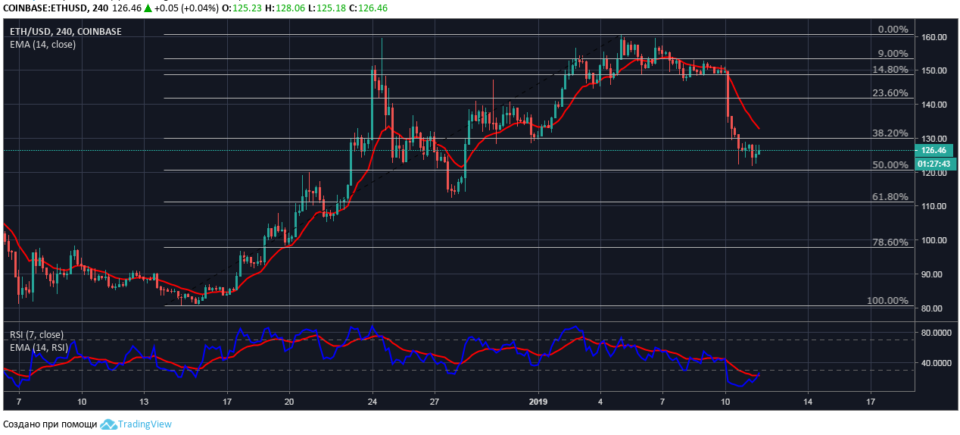
At the time of the market review Ethereum to the United States dollar is quoted at $126,46. The boundaries of the daily trading range, in which a pair of ETH/USD corrected after a 15% drop a day earlier, marked on local levels $128,30 and $122,30.
Assume that the basic levels of support and resistance are formed on the lines of the price correction 38,2%-$130,00 and 50.0%-$of 120.60.

Breakdown support at the lower boundary of the designated range maximally increase the risks of a collapse of Ethereum to the levels of the minimum prices of the past year. Accordingly, the output of the ETH price above the 38.2% retracement level will strengthen the position of the bulls and will consolidate the volumes to restore medium-term uptrend.
At the moment the line is the relative strength index moving average supported EMA14, but not crossed the border of the oversold area, indicating insufficient power buyers for scrapping the nearest resistance level sales of $130,00.
It is expected that no effect on the rate of strong fundamental factors, the price of Ethereum will continue sideways movement in the range of $130,00-120,00.
.