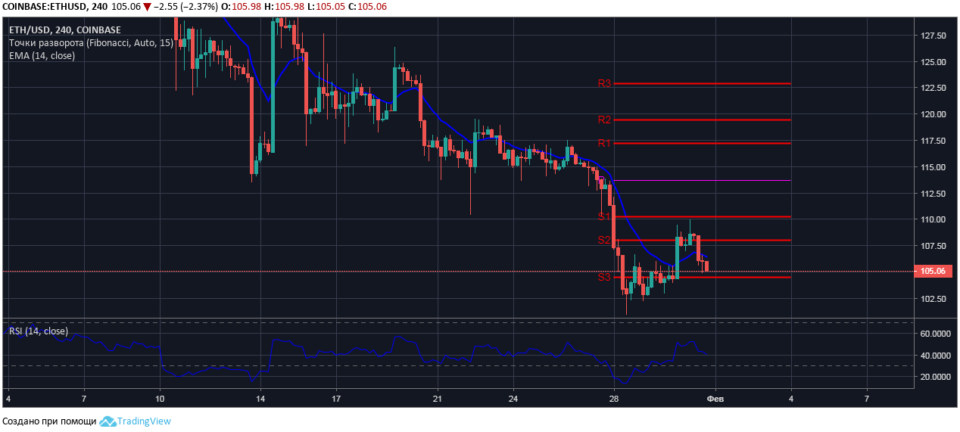
At the ethereal auction on February 1, a short-term decline in the quotes of ETH / USD to the mark of $ 102.80 is possible.
Four hour ETH / USD chart
At the time of market analysis, the ETH / USD pair is trading at $ 105.05 after it lost its support level of $ 108.00 at the opening of the current session. An analysis of the four-hour ethereum chart shows that bears are targeting a key support level of $ 104.50.
The current cryptocurrency price is under pressure from the moving average EMA14 with a value of $ 106.40. The value of the relative strength index is in the area of sales and the RSI14 line is directed downward, which indicates a strong downtrend of the ETH / USD pair in the short-term trading period.

The probable breakdown of support for the ETH / USD pair will open room for cryptocurrency sellers to reduce its quotes at least to the local level of $ 102.80. We believe that the mood of the bulls has not changed and from the level of the January minimum prices on the coupe volumes of purchases ethereum will recover at least to the level of $ 105.00.
.

