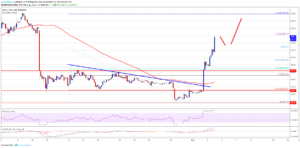
Cash the Bitcoin exchange rate went up sharply, overcoming on the way the resistance levels of $450 and $460. On the four-hour chart of the pair BCH/USD has been a breakthrough of the resistance of the downtrend line ($430). In the near future, a correction, after which the rate of BCH is likely to continue to move up.
Analysis
The offensive bulls started at $410. Resistance levels broke one after the other: $420, $430, $440 (simple moving average SMA 100, the four-hour chart) and $450.
Most importantly, at the level of $430 was formed the resistance of the downward trend line (four-hour chart the pair BCH/USD). Growth could not be stopped, and after overcoming the psychological level of $500 was broken the mark of $530 (1.618 Fibonacci extension from the last recession $482-$407).

In the near future we can expect a rollback to the levels of $480 and $460, suggests that the relative strength index (RSI), after which growth is likely to continue above the line at $500.
Performance review
Convergence/divergence (MACD) pairs for BCH/USD is back in bullish zone. The relative strength index (RSI) is close to the overbought zone.
The main support level of $480 and resistance is $550.

