At the auction on March 14, Stellar and Cardano demonstrate stable growth under the influence of fundamental factors. In the EOS token market, the main players took a wait.
EOS / USD
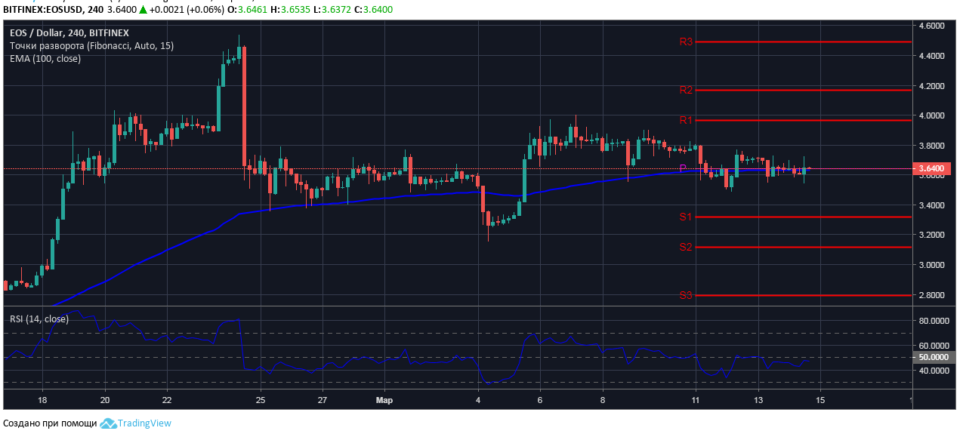
At the time of the market review, the EOS token to the US dollar is quoted at $ 3.6400. At the opening of US trading on March 14, just for one hour, a pair of EOS / USD fixed session minimum and maximum prices at $ 3.5411 and $ 3.7240, respectively.
Despite the short-term radical fluctuations in the movement of quotations, the price of the coin stabilized at the “fair price” level in the area of the moving average EMA100- $ 3.6333 on the four-hour EOS / USD chart. It should be noted that the weekly pivot calculated by Fibonacci for the H4 chart has a value of $ 3.6425 and the price support at the level is enhanced by the EMA100.

The values of the relative strength index are maintained in sales, the RSI14 line is flat and horizontal, indicating a roughly equal balance of sellers and buyers in the short-term EOS market with a higher downside trend.
From the EOS / USD chart, it is obvious that only a breakdown of one of the limits of the $ 3.7290-3.5500 range will determine the direction of the coin in the medium term trading period.
XLM / USD
Medium-term trend Stellar is classified as strong ascending. Additional support for the XLM coin was provided by news from the Coinbase cryptocurrency exchange. Since March 13, a four-stage process of preparing for the launch of trading in pairs XLM / USD, XLM / EUR and XLM / BTC has been launched on the Coinbase Pro platform. It is known that trading on Stellar will begin only after a set of sufficient volumes of cryptocurrency to support liquidity.
At the time of the market review, Stellar to the US dollar is quoted at $ 0.1092 against the session high of $ 0.1148, which was fixed by the price at the opening of the current session.

The value of the relative strength index is consistently maintained in the area of purchases, the RSI14 line tends to turn upwards from level 60, which signals the end of the correction of the short-term upward movement.
We believe that in the March 15 trading in a cryptoactive asset, the bulls will test sales resistance at the second key level of $ 0.1120 with a high probability of updating the local maximum price.
ADA / USD
During the current session, Cardano trades with relatively high price volatility. Session extremes of the ADA / USD pair were fixed at $ 0.0481 and $ 0.0457.
At the time of the market review, the pair is quoted at $ 0.0467 amid the bears’ attempt to consolidate above the key resistance level of $ 0.0466. The current price of the coin is high above the moving average EMA200. The moving line maintains the upward direction, which characterizes the trend of the pair as bullish, in the correction phase.

An analysis of the ADA / USD chart shows that for the development of an uptrend, bulls need to overcome sales resistance at a key level of $ 0.0483. Considering the data of technical indicators and the nature of the price movement, it is to be expected that already at the auction of the asset on March 15, buyers will test the resistance at the designated level.
On the four-hour chart of the pair with the RSI14 indicator, bullish divergence has formed, which gives a strong signal of rising Cardano prices. ADA purchases are recommended at the breakdown of sales resistance at a key level of $ 0.0483, with targets for longs $ 0.0477 / $ 0.0483 / $ 0.0490.
Trading recommendations are not a guide to action. Following the recommendations, you assume the associated risk of loss of funds.
.

