The bears in the second half of session on 12 January increased the pressure on the price of bitcoin.
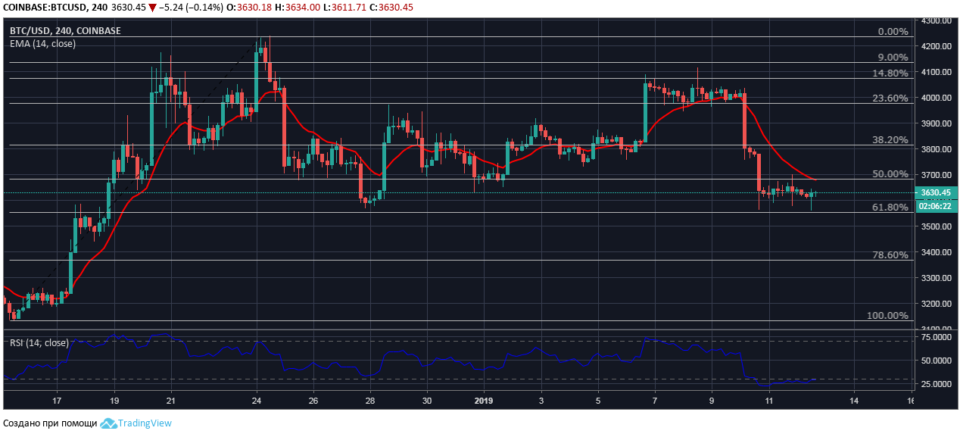
The four-hour chart of BTC/USD
At the time of the review of the market BTC/USD is trading at $3630, Quotes bitcoin recover after a bear test at the support price level of the price correction of 61.8%-$3550.
Short-term trading range narrows and the four-hour chart of BTC/USD it is obvious that the nearest “wall” of orders for the sale of the bears form the dynamic level of the moving average line EMA14 with the current value of $3678.

The probability of breakdown of the support and continuation of the down wave from 10 January remains high, as evidenced by formed a bearish divergence between the price chart with the RSI14 indicator. Also, the weakness of the buyers indicates the value of the relative strength index, which is held in the oversold tool.
.