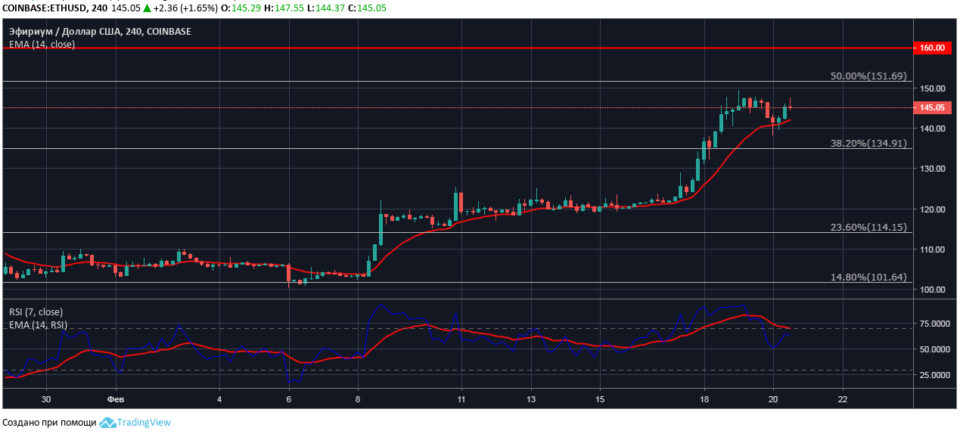
At the auction on ethereum on February 21, breakdown of sales resistance in the range of $ 147.50-151.70 is possible. The immediate goal of buyers is at the historical resistance level of $ 160.00.
Four hour ETH / USD chart
At the opening of the trading session on February 20, etririum sellers with false breakdowns tested the price support. The session low of the ETH / USD pair is fixed at $ 138.16.
An analysis of the four-hour ethereum chart shows that the bulls closest to the current price level will form bulls along the short moving average EMA14.

At the time of the market review, ethereum to the US dollar is quoted at $ 145.00 with a decline from a local maximum of $ 147.55.
The value of the relative strength index is in the area of active purchases, the RSI7 line has turned up from the neutral level on the indicator chart. The RSI intersection of the EMA14 line will signal the consolidation of open long positions on the ETH / USD pair.
.