Ethereum’s Recent Bull Break Puts Its Price Above Daily Ascending Parallel Channel

Ethereum was trading inside a daily ascending parallel channel for 2 months before the bears managed to break below it. Around 5 days ago, bears saw a 10% drop crushing both daily EMAs but still holding the price above the lower line of the channel.
The next day, the bears were able to actually close below the channel line. Everything seemed lost for Ethereum, the daily uptrend was lost and a daily downtrend was basically confirmed.
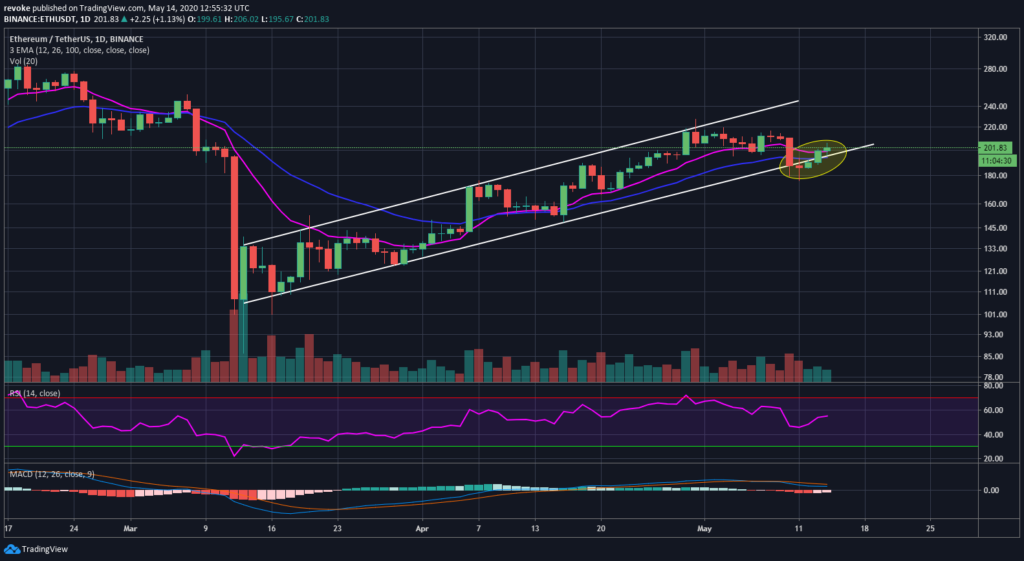
However, the digital asset managed to somehow recover and it is now trading above the lower channel line and both EMAs again but it’s still in a daily downtrend.
The bulls are hoping to close the 12-EMA today and above $200. The daily MACD is also close to a bull break in the next few days.
Ethereum Short-term Outlook
A clear shift in momentum has occurred on the 4-hour chart. The bulls pushed ETH above both EMAs which have crossed bullishly now. They also managed to see a double bull break with decent trading volume.
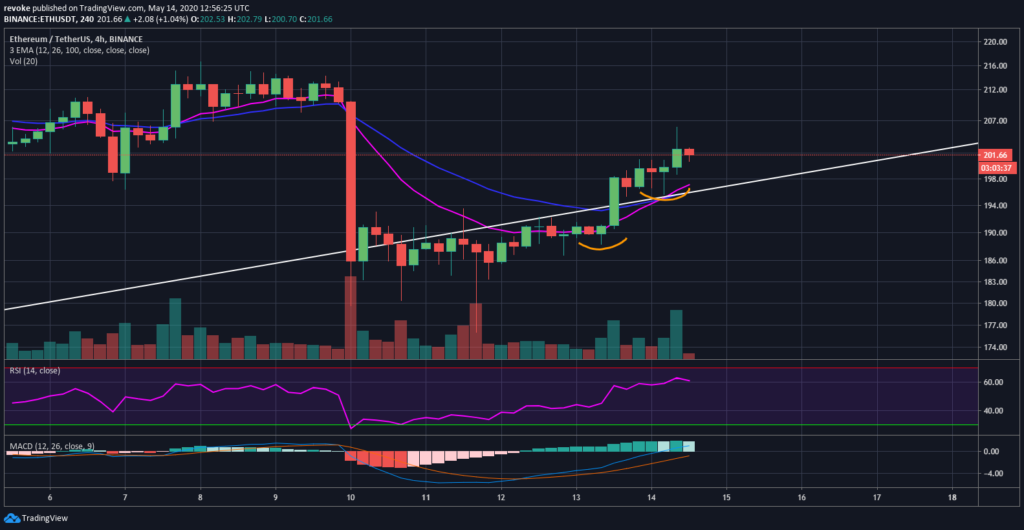
The 4-hour uptrend is looking quite strong right now and the RSI is not yet overextended which means the bulls have more space to see more upside action.
The hourly chart is similar and as long as the bulls can hold both EMAs, they will continue with the 4-hour uptrend. The first red flag for the bulls would be a close below the 12 and 26-EMAs on the hourly chart.
The bulls would then look at the 4-hour chart EMAs for support levels.
Ethereum Long-term Outlook
Ethereum is looking like a great investment for the long-term. The weekly chart, although still in a downtrend, is extremely close to forming an uptrend. The bulls have pushed ETH above $220 and managed to force EMAs to cross bullishly.
ETH is now comfortably trading above both EMAs and the RSI is only at 54 points. Similarly, the MACD turned bullish around 4 weeks ago and it’s getting stronger every week. The bulls would love to see increasing bull volume this week but it’s unclear if they will be able to hit last week’s mark.
The monthly chart could still represent an equilibrium pattern even though the bears did break below $116. The last high is set at $288. If the bulls manage to break above this level, Ethereum could actually go on to set a new ATH.