On the markets of major altcoins bears steadily increasing in volume on sales. Before the end of this week, probably the balance of forces will not change.
XRP/USD
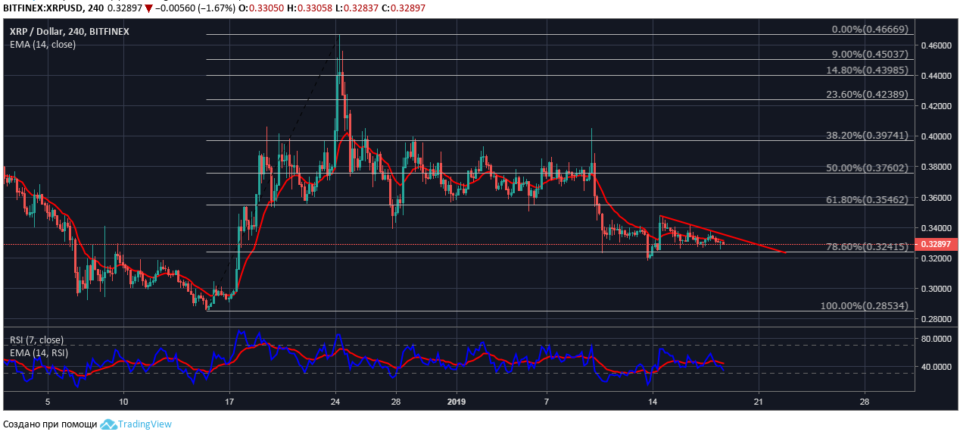
On the four-hour chart of the pair XRP/USD 17 Jan completed the pattern formation of “descending triangle”. As the lower boundary of the triangle should make the level of the price adjustment for 78.6%-$0,3440.
At the time of the review market Ripple listed for $0,3290 under pressure to the moving average value on the price scale of a chart – $0,3321. The value of the relative strength index is in the sales line RSI7 also under pressure EMA14 on the chart and directed downwards to cross the border with the overbought.

At the auction at Ripple on January 18-19, we should expect another attempt of bears to break the weekly support prices. If the sellers will be able to consolidate enough volumes to absorb purchases in the narrow range of $0,3440-0,3180, they will open the scope for declines in XRP/USD to the area prices $0,3000.
BCH/USD
At the time of the market review Bitcoin Cash traded at $126,30 in a narrowing range above the lower limit of the range at around $126,00. The current price of pair BTC/USD is below the moving average line EMA14 with a value of $127,88.
The RSI7 indicator values are in sales, the indicator line directed downwards, which indicates the advantage of the Bitcoin Cash sellers and the probability of their next attempt to break through the price support.

For the development of short-term downtrend bears will have to absorb the volume of purchase in the range of $126,00-122,00. If successful – the sellers will open the space to achieve objectives at the level of the price correction 78,6%-$107,00.
LTC/USD
Pair LTC/USD is trading in a descending triangle at the $31,20 at the time of the market review. Pressure on the quotes of litecoin has EMA14 moving average with a value of $31,76.
These technical indicators indicate a situational advantage sellers. Values of relative strength index in the field of active sales, line КЫШ7 pressure EMA14 moving average and pointing down.

Breakdown support price of litecoin at the lower boundary of the descending triangle will open for sellers of scriptactive scope for declines in the range of $28,30-27,00.
DASH/USD
At the time of the review of the market the sellers Dash local test support level of the price of the cryptocurrency at $69,50. For the development of short-term bearish trend sellers need to break support for the bulls in the range of $69,50-67,50.
Pressure on current quotes DASH/USD has moving average EMA14 with a value of $70,50. The value of the relative strength index is in the field of active sales and the indicator line is pointing down, indicating the advantage of sellers in a short trading period.

It should be noted that in the four-hour chart DASH/USD with the RSI indicator has formed a hidden bullish divergence, which indicates the probability of rebound of the price of the cryptocurrency from the support level of $69,50.
Trading recommendations are not a reference to action. Following the recommendations, you assume all associated risk of loss.
.

