Against the background of the uncertainty of Bitcoin and Ethereum rates, the prices of alternative cryptocurrencies in the short-term trading period demonstrate multidirectional dynamics.
XRP / USD
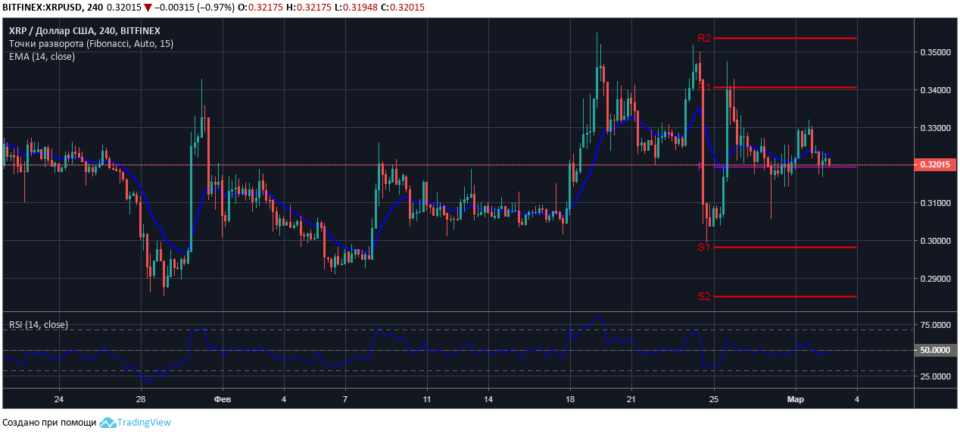
At the beginning of the current session, the bears with the minimum trade in time broke through the support of the Ripple price at the dynamic level of $ 0.3240 and tested the price support for the weekly pivot of $ 0.3194 with a false break.
At the time of the market review, XRP / USD is listed at $ 0.3201. For more than 12 hours, the price of a cryptoactive asset is under pressure from the short moving average EMA14 with a current value of $ 0.3225, which indicates a clear advantage for sellers in the short-term coin market.

The relative strength index data confirms that the bears are increasing pressure on the cryptocurrency price: the index values from March 1 are kept in the sales area, the indicator line is directed down from the neutral level.
In the event that sellers swallow up the volumes of Ripple purchase below the pivot, the cryptoactive price reduction may reach $ 0.3100 at the local support level.
BCH / USD
At the time of analyzing the market situation, BCH / USD is trading at $ 129.40 at a considerable distance from the weekly pivot with a mark on the four-hour chart of the pair – $ 135.50.
From February 24, the price of Bitcoin Cash is under pressure from the downward line of the short moving average EMA14 with the current value of $ 130.25. Temporary support for the price of cryptoactive bulls formed at a local level of $ 127.90. It is unlikely that until the end of the current week buyers will be able to keep the price above the designated level.

The values of the relative strength index for the last seven days are held in sales with conditional support at level 40 of the indicator chart, and a breakdown of the support level with the RSI14 indicator line will give a signal to build up short positions on Bitcoin Cash. Immediate targets of coin sellers are at $ 126.00 and $ 123.50.
LTC / USD
Against the background of the uncertainty of the course of the largest cryptocurrency, the short-term course of litecoin has a clear upward direction. During the morning trading on March 1, the bulls overcame sales resistance at the level of a weekly pivot of $ 47.64, and the pair LTC / USD stopped its five-day growth only at the psychological level of $ 50.00.
At the time of the review, Litecoin is trading at $ 49.45, supported by the market along the short moving average EMA14 with the current value of $ 48.30. The retest of the local resistance level of $ 50.00 confirmed the concentration of significant volumes for the sale of LTC / USD.

There is a chance that until the end of the current trading week, the pair will continue to move sideways with support at the reversal level of the short-term trend with a mark of $ 47.64.
The probable pullback of the coin quotes from the session high of $ 50.38 is indicated by the bearish divergence on the four-hour price chart with the RSI14 indicator line that has formed in the last 24 hours.
Short-term short-term Litecoin sales are possible from the current price with targets of $ 48.62 and $ 48.00. Protective orders for short positions should be placed not below the mark of the session maximum price – $ 50.38.
TRX / USD
At the opening of the Asian session on March 2, the bulls pushed the support price Tron at the local level of $ 0.0240. Having not received market support, the TRX / USD pair in a matter of hours reached $ 0.0230 on the approaches to the first key level S1- $ 0.0228.
At the time of the market review, Tron to the US dollar is quoted at $ 0.0231. A weak correction in the short-term downward movement indicates a high probability of the price falling in the coming hours, at least to the key support level.

The values of the relative strength index are in the overbought area, the RSI14 indicator line is turning down from the overbought zone border. It is recommended that the consolidation of open short positions at $ 0.0232 with profit taking at the support level of $ 0.0228.
Trading recommendations are not a guide to action. Following the recommendations, you assume the associated risk of loss of funds.
.