Over the past two days, BTC has consolidated between a narrow range near the $ 3,800 mark.
The crash can be seen on the 4-hour chart, while the rate dropped to $ 3,650 and quickly recovered to $ 3,800. This could occur after a massive installation of sell orders.
Looking at the 4-hour and 1-day chart, we see that the uptrend line is still strong. However, BTC will have to overcome the level of $ 3,850 in order to return to bullish territory in the short term.
Total market capitalization: $ 130 billion
BTC dominance: 52.1%
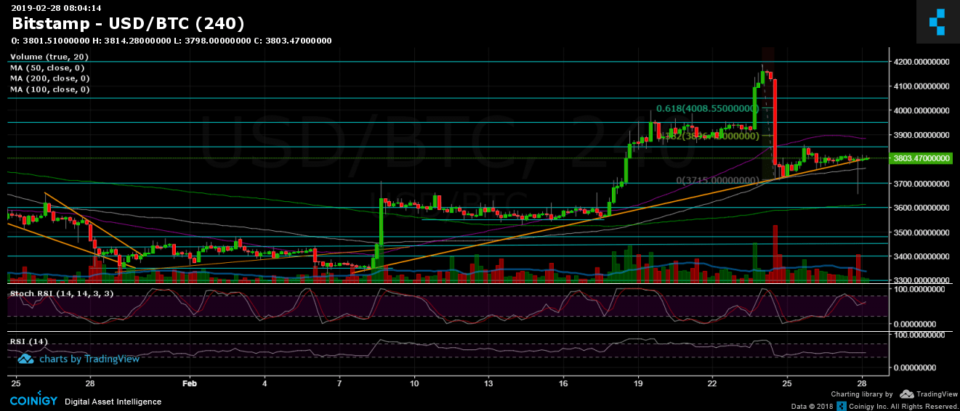
1-day and 4-hour charts
Support / resistance: we see that, in addition to the rising trend line (at the current BTC level), the next significant support level is $ 3,760 (marked in white). Below is the support level of $ 3,700, then the $ 3,600 level (along with the 4-hour MA-200) and the famous support area from $ 3,480 to $ 3,500.
Support has changed resistance levels to $ 3,850, $ 3,900 (along with 4-hour 50-MA) and $ 4,050.

BTC / USD BitStamp 4-hour chart
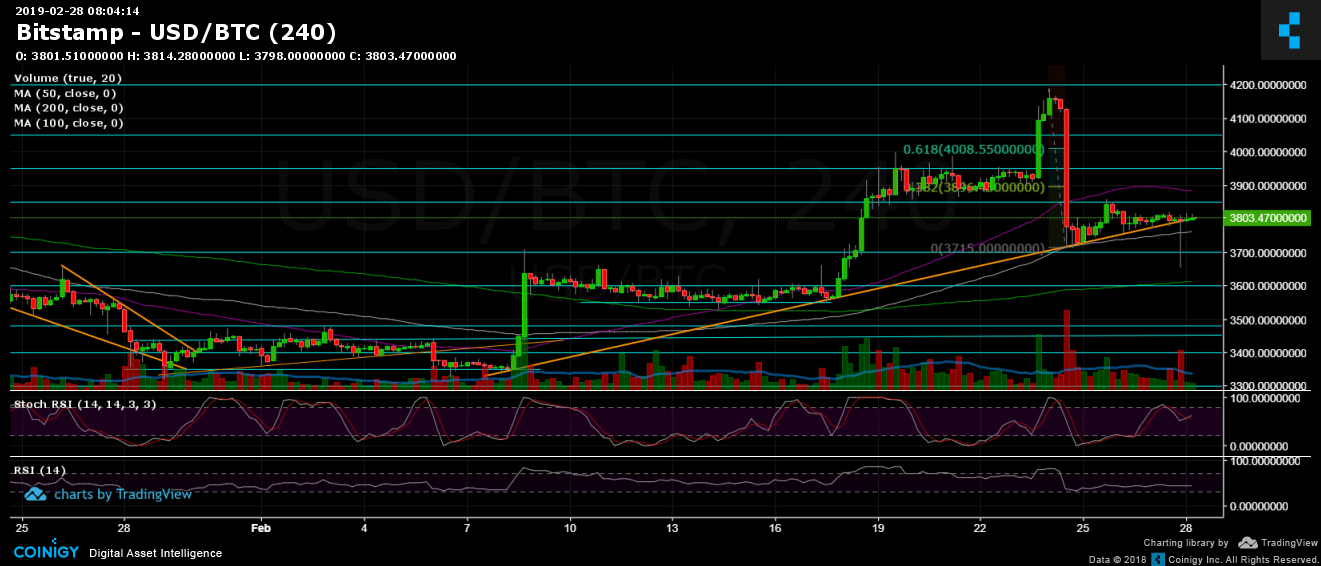
BTC / USD BitStamp 1-day schedule