At the beginning of the trading week, bulls in the ethrium market retreated to a critical support level of $ 130.30.
Four-hour chart pair ETH / USD
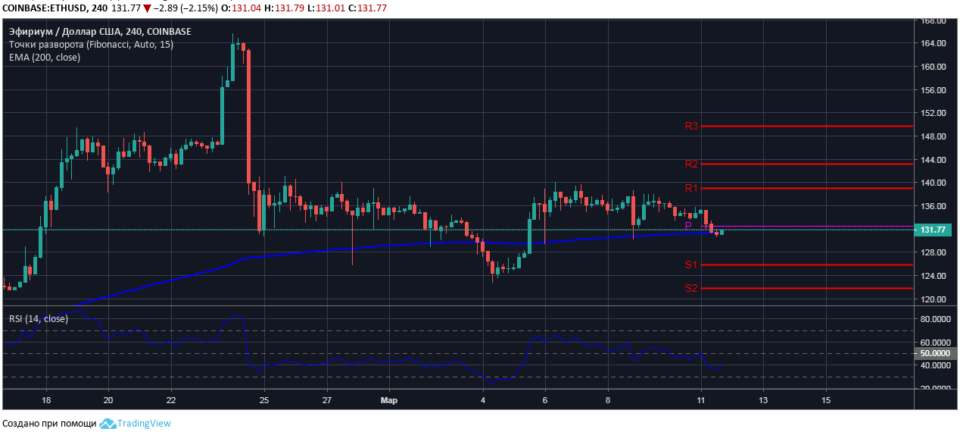
For the period March 11-17, the key support-resistance levels for the ETH / USD pair on the four-hour price chart have been calculated:
- pivot – $ 132.50;
- support levels – $ 125.90 / $ 121.90 / $ 115.30;
- resistance levels are $ 139.00 / $ 143.10 / $ 150.00.
As of 19:30 Moscow time, the ethereum to the US dollar was quoted at $ 131.60 with a slight margin of quotes from the key support level on the moving average EMA200 line with the current value of $ 131.30.

The data on the number of open short and long positions on ETH / USD confirm that the morning decline in quotations of the pair is mostly due to the fixation of profits on a significant part of previously open longs.
At the time of the market review, bulls are trying to restore the price of ETH above the weekly pivot of $ 132.50. For buyers, this is a paramount task, as long-term trade prices below the reversal of the short-term trend will weaken buyers' positions, attract new sellers to the etirium market and, ultimately, bears will break through to the closest target at a key support level of $ 125.90.
.