At the beginning of the new trading week, a sharp decline in trading activity was observed in the largest altcoin markets.
XRP / USD
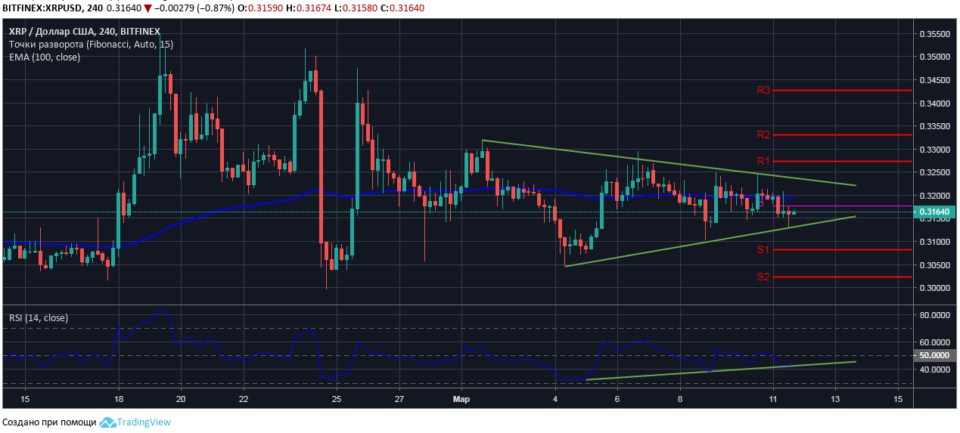
At Ripple trading on March 11, bears “pushed through” the price of a cryptoactive asset below the weekly pivot $ 0.3177. Against the background of unsuccessful attempts by buyers to consolidate above the dynamic resistance level of $ 0.3200, formed along the line of the moving average EMA100, the morning price reduction only confirms the active increase of sales volumes for the XRP / USD pair by sellers.
In turn, with the fixation of the session minimum price at the level of $ 0.3127, the formation of the “symmetrical triangle” pattern on the four-hour XRP / USD chart with an uncertain price-exit direction was completed.

The curve of relative strength index values is also supported by a rising trend line and in case of a breakdown by the RSI14 line from top to bottom of the dynamic support level, a higher likelihood will be a bearish scenario of the situation on the Ripple market. Breakdown of price support at the bottom of the triangle will give XRP / USD sellers room to lower the pair’s quotes to the first key support level of $ 0.3080.
BCH / USD
The lateral movement of the price of Bitcoin Cash along the moving average line EMA100 $ 130.40 today ended with a breakthrough in price support at the reversal level of the $ 128.70 short-term trend.
An analysis of the four-hour BCH / USD chart shows that at a historical support level of $ 125.50, buyers managed to temporarily stop the price reduction.
The activity of Bitcoin Cash buyers remains at an extremely low level, which maintains forecasts for a further slide in the price of the coin towards the key support level of $ 123.00.

The advantage of sellers in the short-term market BCH / USD is confirmed by the relative strength index data: the indicator values are in the area of active sales, the RSI14 line is directed downwards.
Short-term sales of BCH are recommended from the price level of $ 127.90 with targets of $ 125.50 and $ 124.00. Short positions should be protected by orders not below the dynamic resistance level with the current value of $ 130.30.
LTC / USD
The mid-term trend of lightcoin is classified as ascending. The pair LTC / USD is supported by the moving average EMA100, the trend indicator line is directed upwards. Despite the current trend correction, the price of the cryptoactive asset is confidently holding above the reversal level of the short-term trend of $ 54.80.
At the time of market analysis, Litecoin is priced at $ 56.10 with a decline from the session high price at $ 58.48. At the opening of the European trading period, the bulls confirmed support for the price at the level of the weekly pivot $ 54.80.

The RSI14 indicator data confirms the situational advantage of lightcoin sellers: the index values are in sales, the RSI line tends to turn down.
It is assumed that in the next 24 hours, the LTC / USD pair will move in the lateral direction, remaining within the price range of $ 54.80-56.80.
Trading recommendations are not a guide to action. Following the recommendations, you assume the associated risk of loss of funds.
.