The price of ethereum at the beginning of the trading week has been dropped by bears to the second key support level of $ 122.70.
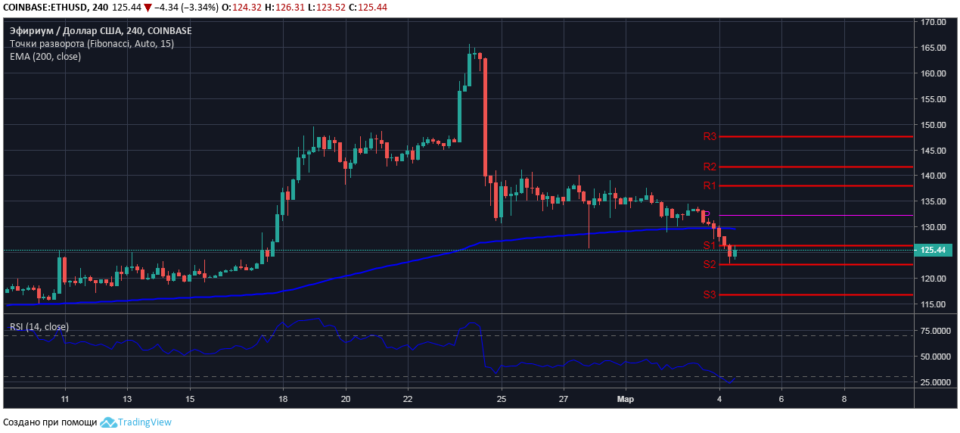
Four-hour chart pair ETH / USD
For the trading period of March 4-10, the key support-resistance levels for the ETH / USD pair on the four-hour chart are calculated:
- trend reversal level – $ 132.20;
- support levels – $ 126.30 / $ / 122.70 / $ 116.80;
- resistance levels are $ 138.00 / $ 141.70 / $ 147.60.
On March 2, ethereum sellers confidently fixed themselves below the local support level of $ 133.80 and, by steadily increasing sales, by the end of the trading week they broke the price support at the dynamic level of $ 129.80, formed along the EMA200 moving average.

An analysis of the four-hour ETH / USD chart shows that, to the second key support level of $ 122.70, the pair’s quotes declined without any attempts on the part of the bulls to defend their positions.
At the time of the market review, the price of ethereum is consolidating in the range of $ 122.70-126.30. The values of the relative strength index are in the oversold area of cryptocurrency, the RSI14 line is directed upwards at the border of the region, which indicates the likelihood of a short-term corrective increase in the ETH price.
.