Against the background of the lateral movement of Bitcoin prices, the prices of the largest Altcoins demonstrate multidirectional dynamics.
XRP / USD
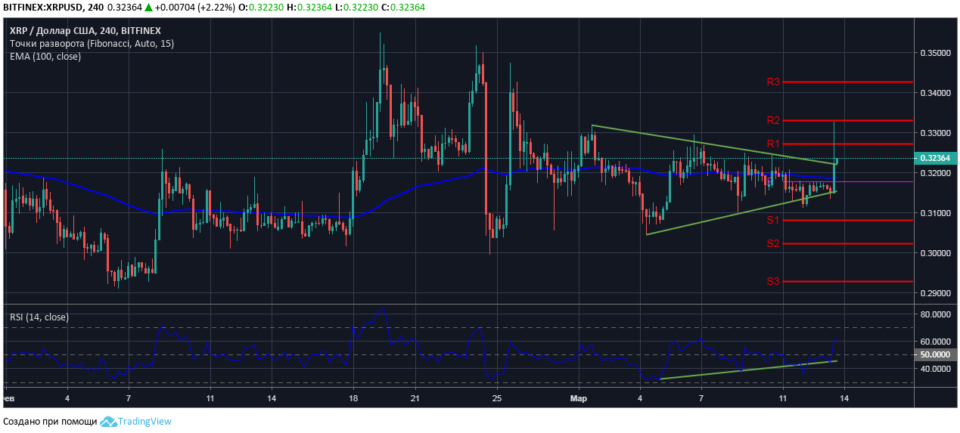
In the previous market review, we predicted a Ripple price exit from a symmetrical triangle on a strong impulse, since from March 6, the parties consolidated large volumes of open positions in cryptocurrency in a narrowing range.
At the trading on the XRP / USD pair on March 13, the bulls broke through sales resistance at the level of a weekly pivot of $ 0.3177, which was strengthened by the moving average EMA100. Session high Ripple price recorded at the second key resistance level of $ 0.3330.
The rollback of the cryptocurrency price from the session high was as rapid as its growth, which indicates the presence of large volumes of Ripple sales above the key resistance level of $ 0.3273.

At the time of the market review, the XRP / USD is quoted at $ 0.3236. The bulls supported the cryptoactive price over the historic $ 0.3220. The values of the relative strength index are in the shopping area, the RSI14 line is directed upwards.
Bulls have an advantage in the short-term Ripple market, and there is a high probability that the next 24 hours the coin price will test sales resistance at a key level of $ 0.3273.
BCH / USD
The last 24 hours Bitcoin Cash is trading in a narrowing range, the upper limit of which is formed by the level of the reversal of the short-term trend of $ 128.70. Also, the current BCH / USD price is under pressure from the EMA100 moving average with a value of $ 129.50, which indicates a significant advantage in the coin seller market.

Nevertheless, according to the relative strength index data, given the consolidation of volumes of open positions in a narrowing range, there is a high probability of a strong uptrend breakdown in the resistance price of sales in a narrow range of $ 128.70-129.50.
From a technical point of view, to strengthen the position of the bulls enough to consolidate above the local resistance level of $ 131.00.
LTC / USD
In the morning trading on Litecoin on March 12, the bulls broke through sales at the pivot level of $ 54.80 and fixed a new local maximum price at the technical resistance level of $ 58.00. However, the bulls failed to overcome the level of resistance in the next 20 hours.
At the time of the market review, the LTC / USD pair is adjusted in the price range of $ 59.00-56.00, the lower limit of which is at the mirror support-resistance level.

Bulls in the lightcoin market retain an advantage. The medium-term trend of LTC is classified as ascending, in the correction phase. The EMA100 moving average supports the price of a cryptoactive asset, the indicator line is directed upwards.
At the end of the price correction, it is recommended to look for points to enter the market with longs, at the end of the price from the lower limit of the price range of $ 58.00-56.00, with targets of $ 58.00 and $ 59.40.
Trading recommendations are not a guide to action. Following the recommendations, you assume the associated risk of loss of funds.
.