Price Ethereum paired with the US dollar konsolidiruyutsya in a narrow range. There is a high probability of breaking the lower border of the price range.
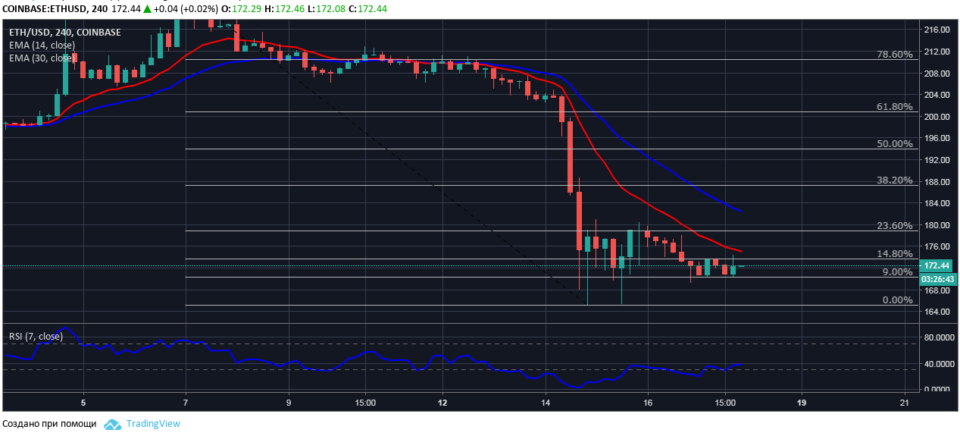
The four-hour chart the ETH/USD
16 November Ethereum is trading in a narrow price range of $173,80-170,40. The range limits are on the technical levels of the price adjustment 14.8% and 9.0% of Fibonacci.
The resistance of the upper border enhances the moving average EMA14 with the current value of $175,00.

On the four-hour chart of the pair ETH/USD with the indicator of the relative strength index RSI7 has formed a hidden bearish divergence.
Considering the downtrend of Ethereum and step-down signals from technical indicators, we assume that during the trading session on 18 November, the bears will perform breakout of the lower border of the price range with the subsequent decrease in quotations pair of ETH/USD to the area prices of $166.
.