Data of technical analysis of bitcoin exchange rate indicate a high probability of declines in the BTC/USD at least to the level of the annual minimum prices.
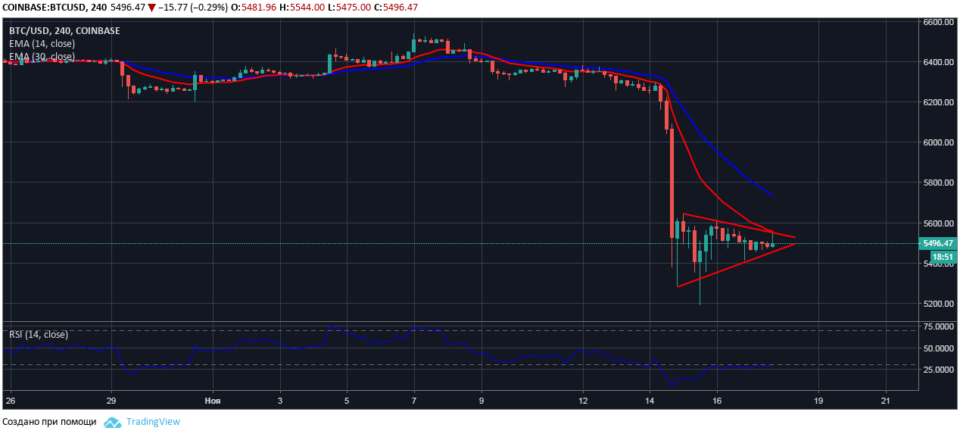
The four-hour chart of BTC/USD
November 14, bitcoin is trading in a narrowing price range. Session high price scriptactive recorded at $5544.
In the course of the session, quotes for BTC/USD met resistance to the growth of the dynamic level of the moving average line EMA14 with the current value of $5556. In turn, the line EMA14 increases the resistance of the upper border of the symmetrical triangle.

Theoretically, the output of the shapes are equally possible in the direction of growth of quotations in the direction of reducing them.
However, given the market situation with dominance of bearish sentiment among investors, the global bearish trend cryptocurrencies and data from technical indicators, we assume that the high probability scenario is the break out of the triangle with the breakdown of its lower boundary.
Speculation about the upcoming reduction in the price of bitcoin confirms formed a bearish divergence on the four-hour chart of BTC/USD and an indicator of the relative strength index. Signal to the sale of bitcoins is enhanced by the fact that the values RSI14 throughout the corrective phase prices do not go beyond the oversold zone.
It is expected that in the next 24 hours on strong down momentum quotes of the pair BTC/USD will update the annual minimum price of the asset at $5188.
.