On the eve of the hard fork "Constantinople," a sharp increase in the volatility of ethereum prices is expected.
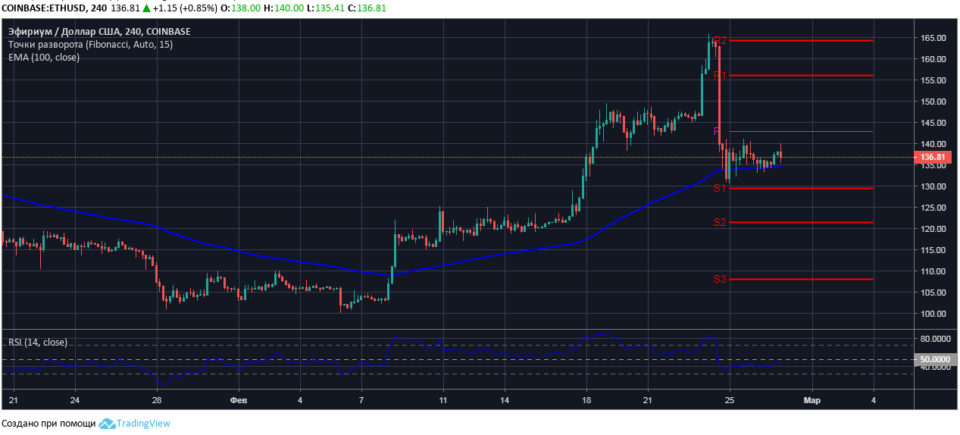
Four hour ETH / USD chart
At the opening of the US trading period on February 27, the bulls tested sales resistance at the local level of $ 140.00. The price rebound from the indicated level shows that the bears are ready not only to defend their positions, but they are also set to increase the volume of open short positions.
At the time of the market review, the ETH / USD pair is trading at $ 136.80 with a decrease in quotes to the dynamic support level formed on the EMA100 moving average line with the current value of $ 134.60.

On the four-hour ETH / USD chart with the RSI14 indicator, there is a bearish divergence, which gives an early signal to reduce the cryptoactive quotations.
In the event of a probable breakdown of support for the price of etrium at a dynamic support level of $ 134.60, we should expect that in the short term, the bears will reach the nearest targets at a key support level of $ 129.50.
.