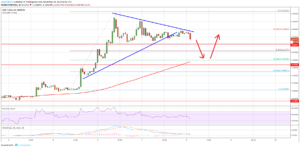
After reaching a high around $0.56 rate of XRP started to be adjusted and were below the rising trend line (hourly chart the pair XRP/USD $0.53).
Yesterday the bulls managed to break through resistance at $0.54. Soon after, he was made high above $0.56. He soon started to dip. as a result of which the XRP exchange rate fell below the level of 23.6% Fibonacci of the last rise of $0.4609-$0.5626.
More importantly, was broken support of the ascending trend line at $0.53 (hourly chart the pair XRP/USD). Bearish counterattack continued, short-term support levels broke one after the other. By the time of this writing, the XRP price has stayed at $0.51. Here support is particularly strong, both because of the psychological factor, and simple moving average 100 hours located at $0.4995.

Soon the third largest cryptocurrency may be corrected on some items. At the end of the current wave of decline, we can expect a return to $0.54.
Convergence/divergence (MACD) for the pair XRP/USD is back in bearish territory. The relative strength index (RSI) fell below 50. The main support level of $0.50 and resistance is $0.54.