Bitcoin [BTC] Blasts Through $8,000, Is The Bull Run in Full Motion?
![Bitcoin [BTC] Blasts Through $8,000, Is The Bull Run in Full Motion?](https://thecryptocurrencypost.net/wp-content/uploads/2020/04/BTCANALYSIS29.jpg)
Surprisingly Bitcoin has managed to break above $8,000 and the $7,700-8,000 resistance area. The bulls still need to close above $8,000, however, everything is looking good for them as Bitcoin is currently trading at around $8,135.
This recent move clearly shows the lack of bears and bear strength as there isn’t a lot of trading volume but bulls still managed to break above a huge resistance area with a lot of continuation.
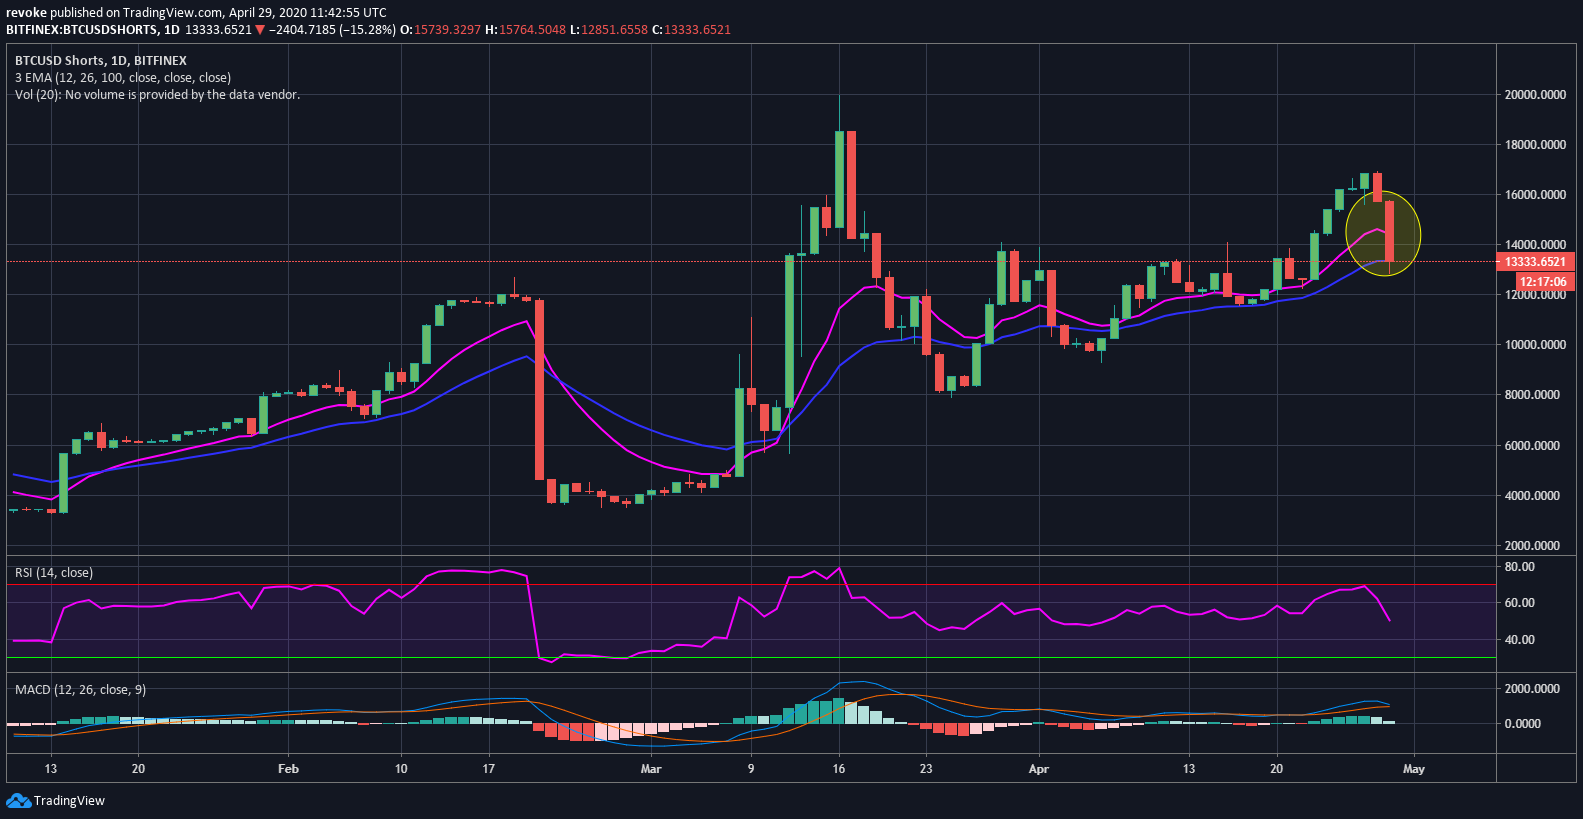
After a big bullish move like the current one, you would expect to see an increase in short positions if the bears are confident that Bitcoin will fall, however, looking at Bitfinex short positions, it’s clear that bears don’t want anything to do with Bitcoin right now as they have dropped 15% today.
Bitcoin Short Term Outlook
The daily uptrend for Bitcoin is robust and would take bears a long time to break it. The last low is set all the way down at $6,940 which means that anything above this level would represent a higher low and the uptrend would remain intact.
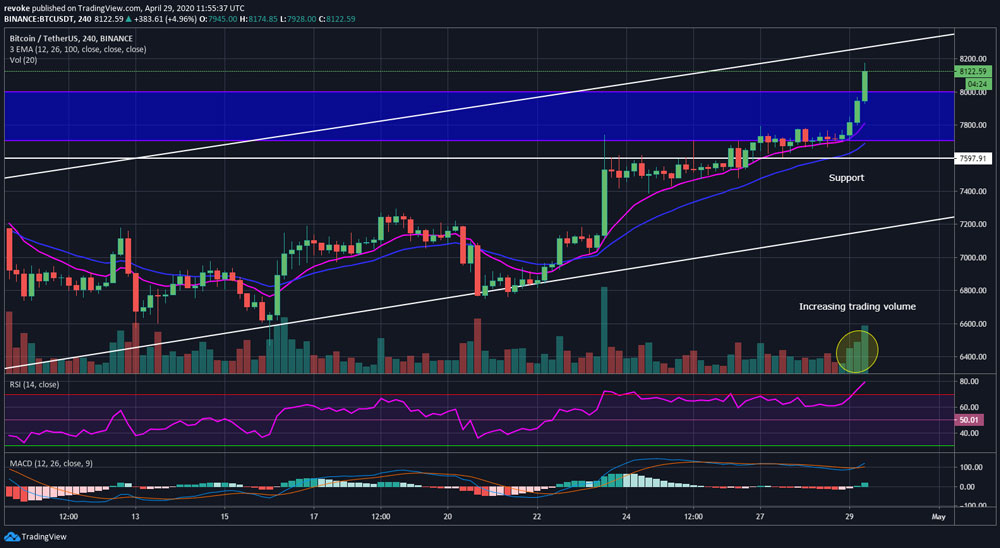
Shorter time frames like the 4-hour chart are also extremely strong. The last 3 candlesticks have seen a significant increasing bull volume even though the RSI is hitting 80 points. Considering the magnitude of the recent move, it’s unlikely for the bulls to stop just because the RSI is overextended. The bulls are looking at $7,606 as the last support as well as $8,000. Ideally, they would want to hold $8,000 today and close above it.
Bitcoin Long Term Outlook
Obviously, the short-term for Bitcoin is good but how about its long term outlook? The weekly chart, although still in a downtrend, is highly favoring the bulls right now which have been able to see gains 7 weeks in a row.
Bitcoin is currently trading above the 12 and 26-period EMAs and the bulls are now looking for a bull cross in the next 2 weeks. The MACD is on the verge of a bull cross and the RSI is only at 52 points.
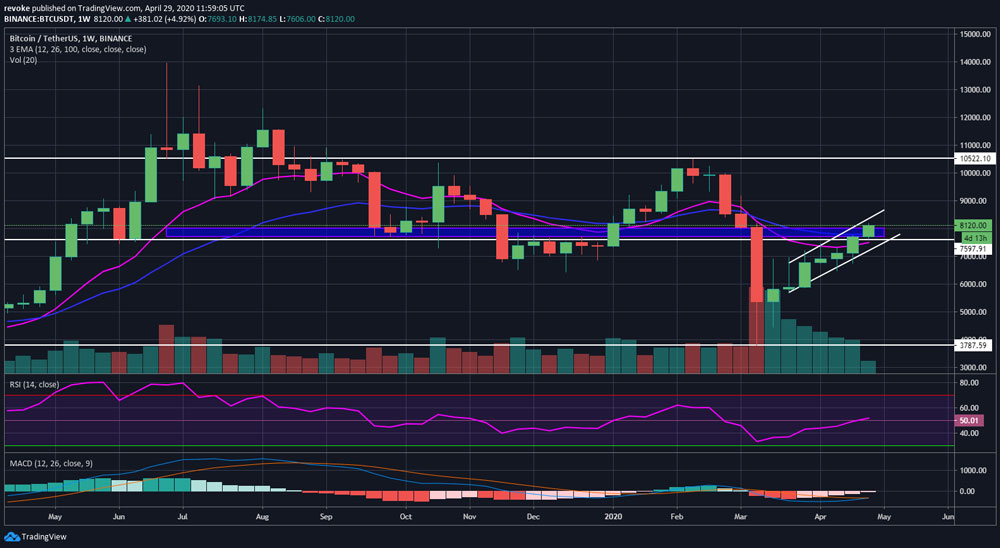
The weekly chart really shows the decreasing trading volume that Bitcoin has experienced for the past 8 weeks which again points towards the lack of strength the bears have right now.
The monthly chart is basically the same as the weekly chart, favoring the bulls but in a downtrend.