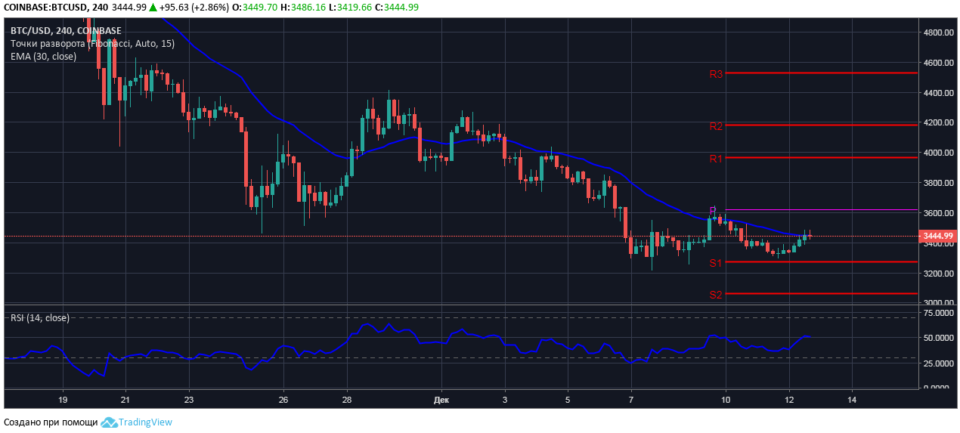
For the development of local upward movement of bitcoin prices the markets need to absorb the volume of sales above $3450.
The four-hour chart of BTC/USD
In the course of trading on 12 December the price of bitcoin to US dollar recorded a maximum value of $3486. At the time of the review of the market BTC/USD is trading at $3448, the dynamic level of resistance.
In that case, if bulls are able to absorb the volumes on sale and to gain a foothold above the marked level, they will be able to consolidate additional volumes and reach test resistance at pivot level, trend $3620.

However, these technical indicators indicate an exhaustion of buyers. Early signal for a decrease in quotations BTC/USD gives the formation of a hidden bearish divergence on the four-hour chart the asset price with the RSI14 indicator.
At the same time, the values of relative strength index has not gone beyond the field of sales and the RSI line tends to spread down from the neutral level of 50.
It is expected that temporary support to the price of bitcoin buyers will have prices of $3400.
.

