At the bitcoin trading on February 10, cryptocurrency buyers will attempt to gain a foothold in the $ 3,630-3,680 range.
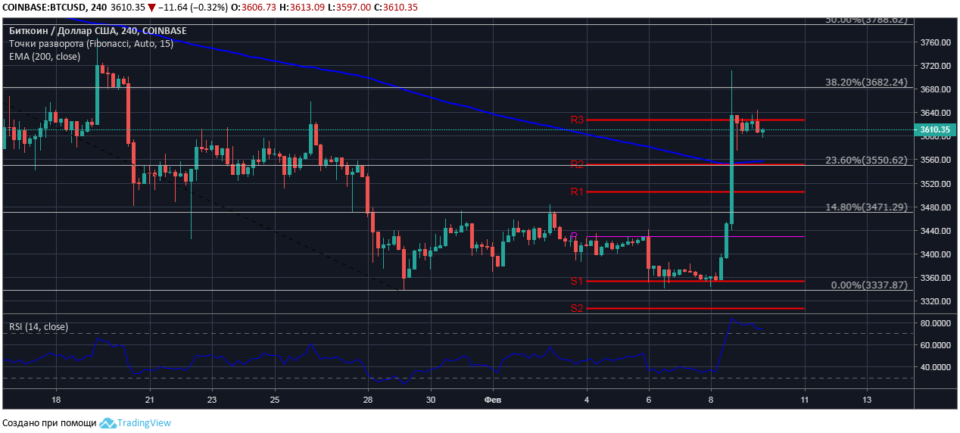
Four-hour chart BTC / USD
Trading in Bitcoin on February 8 closed with growth of + 7.83% at $ 3,622. The session high of the BTC / USD pair recorded at $ 3,711 against the opening price of $ 3,359.
At the time of the market review, Bitcoin is trading at $ 3,610. After a sharp rise, the pair is consolidating in a narrow range with a lower limit of $ 3,600. An analysis of the four-hour BTC / USD chart confirms that the bears form resistance at the $ 3,630 key level.

The EMA200 moving average strengthens the support of the second key level R2 and the price correction level 23.6%, the values of which intersect at $ 3,550. The relative strength index is in the area of positive values, the indicator line is outside the oversold area of the instrument and is directed horizontally.
The aggregate data of technical indicators point to a rather strong price growth potential. Bulls will maintain the development of the uptrend, keeping the price above the key level of $ 3,550.
.