At the bitcoin trading on March 8, the cryptocurrency price may rise to the second key resistance level of $ 3,940 on a strong upward impulse.
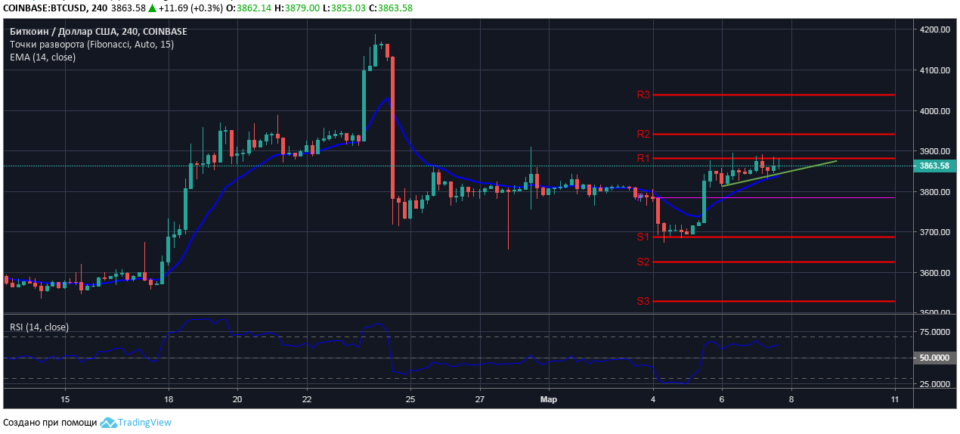
Four-hour chart pair BTC / USD
Since March 5, Bitcoin has been trading in a narrowing price range. The upper limit of the range is formed on the first key resistance level of $ 3880, the lower limit is on the ascending line of the short moving average EMA14.
On the four-hour BTC / USD chart, a pattern of continuation of the “ascending triangle” trend with a target level of $ 3,950 was formed, ten points above the second key resistance level of $ 3,940.

On the four-hour chart of the bitcoin price with the RSI14 indicator, a hidden bullish divergence formed, which we consider as an early signal of the continuation of the upward movement of the cryptoactive.
Earlier, we considered options for developing a market situation in which a new round of coin price growth is possible on a strong upward momentum. The formation of bullish divergence and the “ascending triangle” pattern reinforce the findings of previous forecasts .
We believe that already on March 8, in the course of trading in Bitcoin, the bulls will test the resistance of sales at the key level of $ 3,940.
.