Technical analysis of the etirium data indicates a high probability of breakdown of sales resistance at a price level of $ 140.00 by the end of the current week.
Daily chart ETH / USD
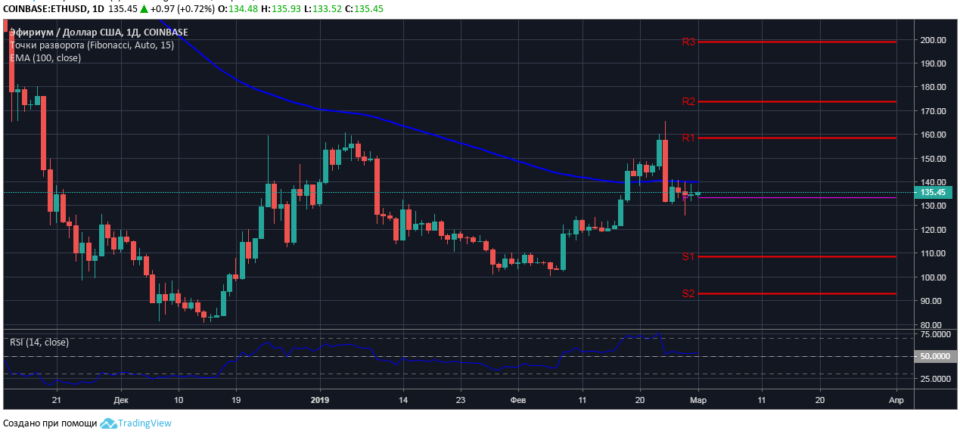
On the daily chart of ETH / USD, key Fibonacci support-resistance levels for the new thirty-day trading period have been calculated:
- trend reversal level – $ 133.40;
- support levels – $ 108.40 / $ 92.80 / $ 68.00;
- resistance levels are $ 158.40 / $ 173.90 / $ 198.90.
Analysis of the daily chart ETH / USD shows that the main resistance to the growth of a pair of bears formed at a dynamic level, along the line of the moving average EMA100 with a value at the price mark of $ 140.00.

At the time of the market review, ethereum is trading at $ 135.45 in a horizontal channel with borders at the level of thirty-day pivot and the moving average line EMA100.
The data of the relative strength index indicate a strengthening of the positions of buyers with a high probability of upward movement of the ETH / USD pair in the short term. It is expected that before the end of the current week, buyers will test the density of volumes on sales above $ 140.00.
From the daily chart of ethereum, it is obvious that the breakdown of sales resistance at the price level of $ 140.00 will open to buyers of cryptocurrency the scope for movement towards the main goal of the bulls at the first key resistance level of $ 158.40.
.