At the ethereum auction on January 27, it is possible to break through the lower boundary of the downward triangle with a subsequent decrease in the price of cryptocurrency to $ 111.00 at a key support level.
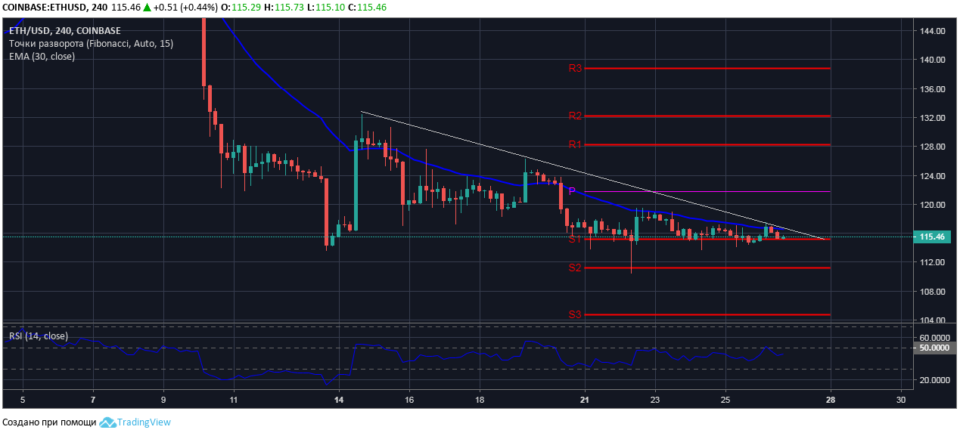
Four hour ETH / USD chart
Since January 14, the ethereum has been trading in a narrowing range, mainly under the pressure of the moving average EMA30 with the current value of $ 116.50. Despite the increasing pressure of cryptocurrency sellers, bulls hold their positions above the lower level of the downward triangle of $ 113.50.

At the time of the market review, ETH / USD is quoted at $ 115.40. Analysis of the four-hour chart shows that the price of cryptocurrency is ready to go beyond the pattern. Given the accumulation of large volumes of short and long positions on the ethereum, we believe that the breakthrough of the boundaries of the narrowing range will take place on a strong impulse.
According to the theory of graphical analysis, a high probability has a breakthrough of the lower boundary of the descending triangle with the achievement of the goal at the third key support level of $ 111.00.
.