An unexpected price surge in cryptocurrency markets allowed the largest altcoins to fully compensate for the losses of the past day.
XRP / USD
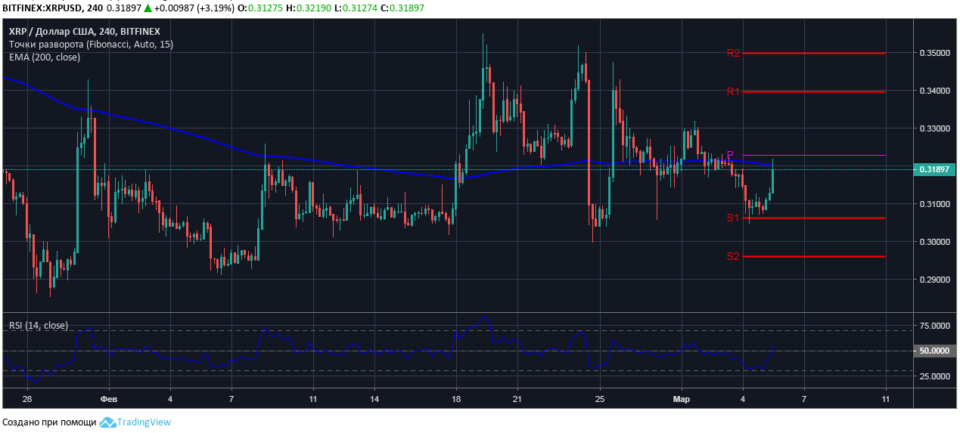
At the time of the market review, Ripple is trading at $ 0.3189 against the price mark at the opening of the current session – $ 0.3091. The maximum growth of the XRP / USD pair on March 5 was + 4.14%. The session maximum of the Ripple price is fixed at $ 0.3219, a few points below the weekly pivot $ 0.3228.
To fix the price in new positions, bulls need to be overcome by selling resistance at a dynamic level, formed along the line of the moving average EMA200 with the current value of $ 0.3205.

The nature of the price movement and the data of technical indicators indicate a significant advantage for buyers in the short-term Ripple market. The upward impulse is strong enough and the false breakdown tested resistance at the dynamic level, the value of the relative strength index is above the neutral level on the indicator chart, and the RSI14 line is directed vertically at right angles.
We believe that the price correction will be short-term, not lower than the local support level of $ 0.3185. At the end of this level, short-term Ripple purchases are recommended, and building up already open long positions with targets at $ 0.3205 / $ 0.3228 / $ 0.3242.
BCH / USD
The upward trend in Bitcoin Cash prices has been clearly visible since the opening of the current trading session. A little more than six hours, the bulls methodically bought the volumes for sale to BCH, which significantly weakened the resistance of bears at the key level of $ 125.60 and allowed the price on the upward impulse to break through the resistance of sales at the pivot level of $ 130.60.
The session high of the BCH / USD pair is fixed at $ 131.45 with the daily increase in the price of the coin by 6.0%. At the time of the review, the price of Bitcoin Cash is fixed at the level of the reversal of the medium-term trend, the support of the level is reinforced by the moving average EMA200 with the current value of $ 130.00.

The RSI14 line at right angles crossed the neutral level of 50 on the indicator scale and, despite the price correction from the session high, maintains a tendency to move upwards, which indicates a rather strong market support for the BCH / USD pair.
It is expected that before the end of the current session, the bulls will surely consolidate above the key level of $ 130.60 and update the price highs from February 28 to March 1 in the area of $ 132.70.
LTC / USD
During the current session, lightcoin is confidently leading in terms of daily price growth, among the largest cryptocurrencies, with an intermediate result of + 12.50%. LTC / USD fixed the session high at $ 53.42, against the opening price of the day – $ 46.88.
At the time of the market review, the price of a cryptoactive asset after a rapid rally is adjusted at the local mirror level of $ 52.60. The pair is supported by the moving average EMA200.

The values of the relative strength index are in the region of moderate overbought, the indicator line is directed upwards, which indicates a strong potential for an upward impulse to continue the growth of the price of litecoin.
It is expected that the outcome of the current session, at a minimum, will be fixing the LTC / USD pair above the support level of $ 52.60, with a high probability of bulls trying to break through the key resistance level of $ 54.50.
Trading recommendations are not a guide to action. Following the recommendations, you assume the associated risk of loss of funds.
.