Highlights:
- If the support level of $ 3,679 is not maintained, $ 3,241 will become a new target.
- Bullish momentum may continue to grow.
- BTC / USD long-term trend: bullish.
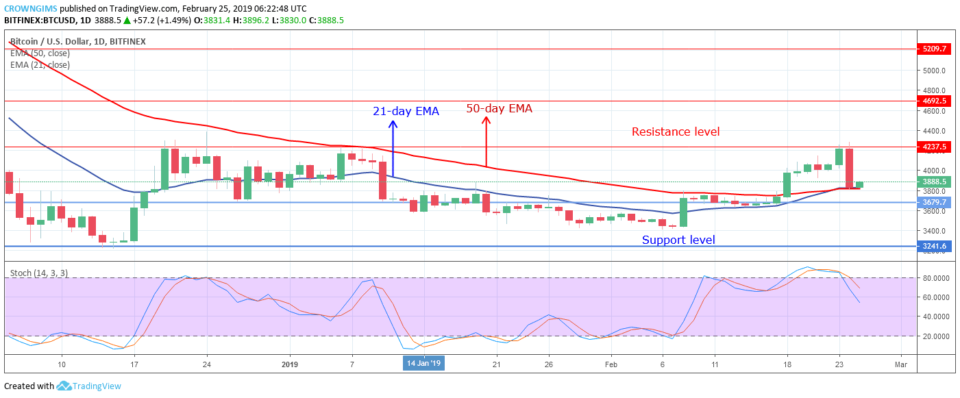
Resistance Levels: $ 4237, $ 4692, $ 5209
Support Levels: $ 3,679, $ 3,257, $ 2,765
A pair of BTC / USD in the long term is aimed at growth. Last week, the cryptocurrency erupted in a merger that pushed the BTC price to $ 3,679. The merger at the level was one of the reasons why the price of bitcoin dropped ten days ago.
The bullish impulse pushed the coin out of the consolidation phase on February 18 and formed a bullish candle. The bullish impulse spread to the resistance level of $ 4237, but could not break through this level due to bears. The massive bear candle, formed at the resistance level of $ 4237, did not allow a further increase in the price of bitcoin.
The BTC price is traded at the 21-day EMA and the 50-day EMA, in which two EMAs are located at the intersection point. The price of cryptocurrency is $ 3834. If the bulls cannot defend the support level of $ 3,679, then the price of bitcoin will find its minimum at the support level of $ 3,241.
Alternatively, if the support level of $ 3,679 is held and the coin rebounds, the bullish momentum may raise the BTC above the resistance level of $ 4,237.
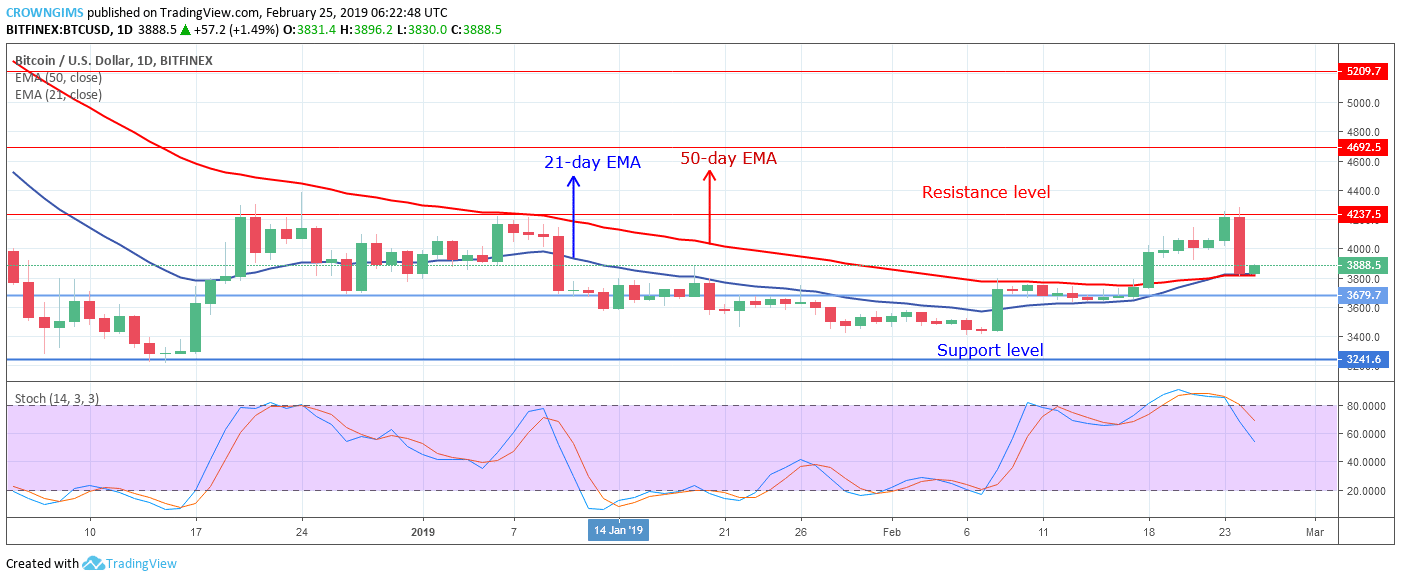
Medium-term trend BTC / USD: Bearish
Cryptocurrency has a bearish attitude in the medium term. BTC / USD was on a bullish trend last week, the coin updated highs inside the growing wedge to the resistance level of $ 4237. Bears with high momentum caused a sharp and sudden decline in the price of BTC. The rising wedge was broken, and the price of bitcoin fell to a support level of $ 3,679.