During the current trading session buyers accumulate bitcoin volume to break the resistance of the sales at the key level of $3550.
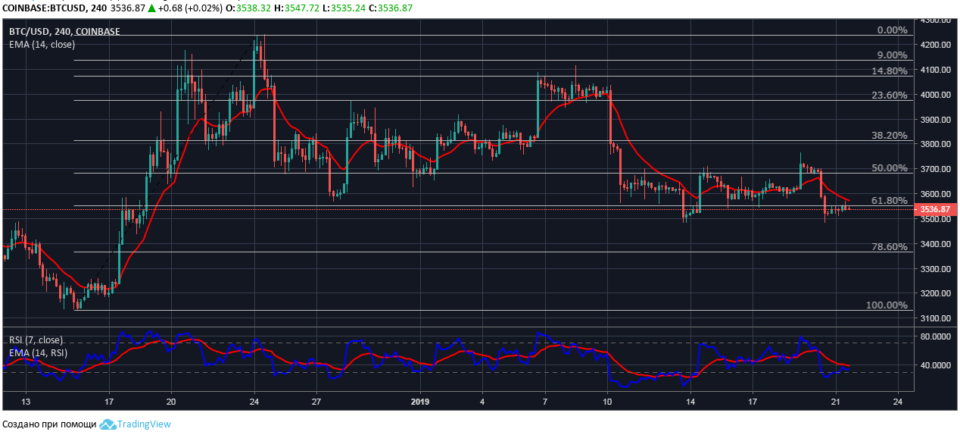
The four-hour chart of BTC/USD
At the time of the market review bitcoin to US dollar traded at $3536, below the level of the price correction of 61.8%-$3550. EMA14 moving average with a value of $3574 puts pressure on the current price of the cryptocurrency and increases the resistance of the sales at $3550.
A false breakout of the resistance level with fixation session high price at $3569 confirms the consolidation of large volumes for sale in the range of $3580-3550. Breaking above the designated range, the bulls will partially reduce the pressure on the pair BTC/USD.

From a technical point of view, in the short term, there is a likelihood of a bullish scenario, as indicated by the data of the relative strength index. The index value in sales and pressure EMA14 on the chart, but the RSI line is pointing up to the intersection of the moving average.
The price movement of bitcoin during mid-day trading does not exclude the bullish breakout of resistance on strong upside momentum, a similar break of January 14.
It should be noted that prolonged protorgovki tool below the key level will attract additional volumes of sellers and will allow you to develop a downward movement of the pair BTC/USD to the level of the price adjustment for 78.6% of$3370.
.