Until the end of the current week, Bitcoin will continue to move within the range of $ 3,600- 3,500.
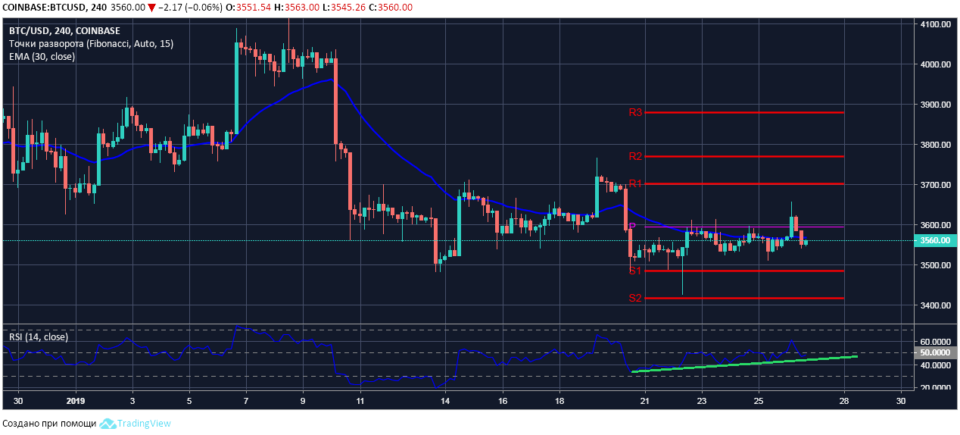
Four-hour chart BTC / USD
At the time of the market review, Bitcoin is trading at $ 3,560 against the session high at $ 3,658. The current quotes of the BTC / USD pair are again under pressure from the moving average EMA30 with a value of $ 3,568 on the price scale.
The RSI14 indicator data indicate a roughly equal ratio of bear and bull forces in the short-term bitcoin market: the index value dropped to a neutral level, the RSI line is horizontally directed.

It is assumed that during the session on January 27, the BTC / USD pair will continue to move in the lateral direction, in the price range of $ 3,600- 3,500. Before the end of the current session, the bitcoin price may fall to the lower end of the range, a signal of a sharp increase in sales will be the breakdown of the RSI line of the conditional uptrend line support on the indicator chart.
.