Bulls in the Bitcoin market are fixed at a new price level, above the key resistance of $ 3,945.
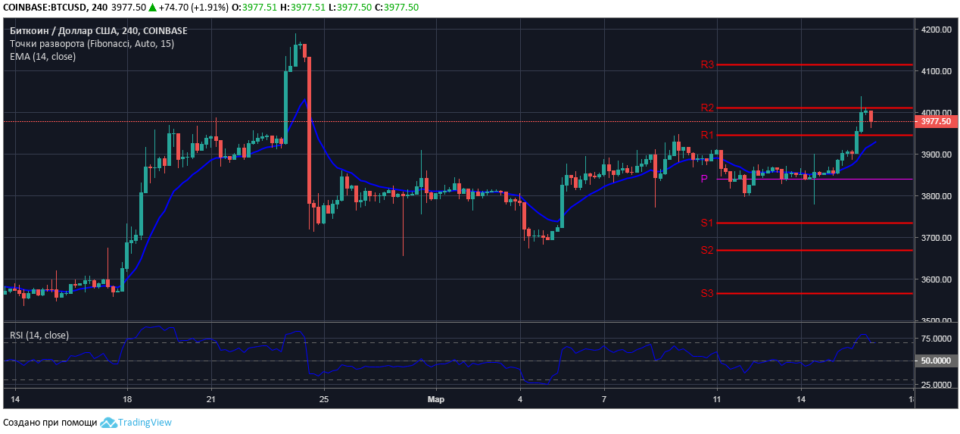
Four-hour chart pair BTC / USD
The breakthrough of Bitcoin prices above the first key resistance level of $ 3,945 was evident when the bulls began to actively absorb the sales volumes on March 15, which were concentrated at the local resistance level of $ 3,910.
On a strong upward impulse, the BTC price overcame sales resistance at the R1 level and tested the key level R2- $ 4010 with a false breakdown. The session maximum of the bitcoin price paired with the US dollar on March 16 is fixed at around $ 4037.

At the time of the market review, BTC / USD is listed at $ 3,977. The price of the cryptoactive asset is adjusted after strong growth, and the bulls need to keep the price above the level of $ 3,945, which is currently reinforced by the moving average EMA14, in order to maintain the advantage of the largest cryptocurrency currency in the medium term.
.