At the end of the week leading altcoins bargain in different directions, not having a pronounced course.
EOS / USD
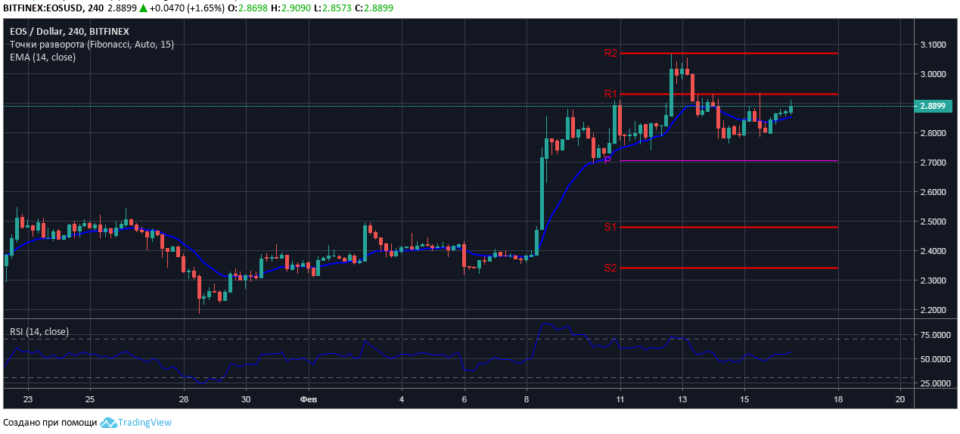
At today's auction, the EOS token showed an increase of 3.4% against the daily opening price of $ 2.8435. At the time of the market review, EOS / USD is listed at $ 2.8899. The session maximum price of the token is fixed at $ 2.9090.
It should be noted that a “double bottom” pattern has been formed on the four-hour cryptocurrency chart with a target level at the level of $ 3.0700 of the second key resistance level.

The value of the relative strength index is kept in the purchasing area, the RSI14 indicator line is directed upwards, the current price of the cryptoactive asset is above the short moving average EMA14 with a value of $ 2.8570, which indicates that buyers have an advantage in EOS trading.
It is expected that before the end of the current session, the bulls will test resistance at a key level of $ 2.9290.
XLM / USD
At the beginning of the trading session on February 16, Stellar sellers sharply increased cryptocurrency sales, which allowed them to break through support at the level of the weekly pivot $ 0.0800 and fix the session minimum price at $ 0.0788.
The nearest support level is at $ 0.0780. In case of breakdown of the indicated level, the price reduction may reach the level of $ 0.0755.

The value of the relative strength index is kept in the shopping area, the RSI14 line is directed downwards and the suppression of its neutral level will give a signal for increasing short positions.
Stellar sales are recommended after confirmation of support breakdown at $ 0.0789 with targets of $ 0.0770 and $ 0.0760.
ADA / USD
At the time of the market review, Cardano is trading at $ 0.0408, higher than the weekly pivot $ 0.0404.
Analysis of the four-hour chart shows that the ADA / USD pair found support at a dynamic level, formed along the line of the moving average EMA100 with a value of $ 0.0400.

At the level of $ 0.0420 from February 8, there is strong sales resistance. Obviously, for the development of an uptrend, bulls need to clear the range of $ 0.0420-0.0430.
However, a bearish divergence formed on the four-hour ADA / USD chart with the RSI14 indicator, which increases the likelihood of the pair s rollback from the session high of $ 0.0409.
Trading recommendations are not a guide to action. Following the recommendations, you assume the associated risk of loss of funds.
.