Despite the advantage of bears in the short-term market of ethereum, the likelihood of a rise in the price of cryptocurrency on purchases of coins by large players remains.
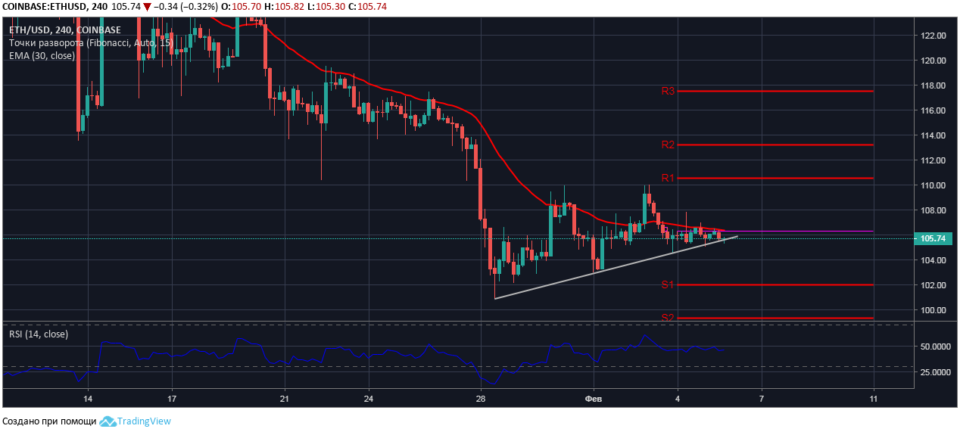
Four hour ETH / USD chart
Attempts by the bulls from February 3 to consolidate above the reversal level of the short-term trend of $ 106.30 only confirmed the advantage of the sellers.
Analysis of the four-hour chart of the ETH / USD pair shows that the main resistance to the growth of quotes is formed along the line of the moving average EMA30 with the current value of $ 106.35.

At the time of the review, ethereum is trading at $ 106.74, predictably decreasing to a dynamic level of support in the area of $ 105.40. The following trading signals are confirmed by the data of technical indicators:
- the current price is below the moving average line EMA30 and the indicator line increases the angle of inclination downwards;
- the value of the relative strength index is in the sales area, the RSI14 line is turning down from the neutral level on the indicator chart.
It is assumed that a high probability of trading on ethereum on February 6 has a bearish scenario in a breakthrough of the dynamic support level and a decrease in price to $ 103.80 at the local support level.
.