The breakdown of the local support level of $ 102.30 will open up to the bears to reduce the price of ethereum for the nearest target at $ 98.00.
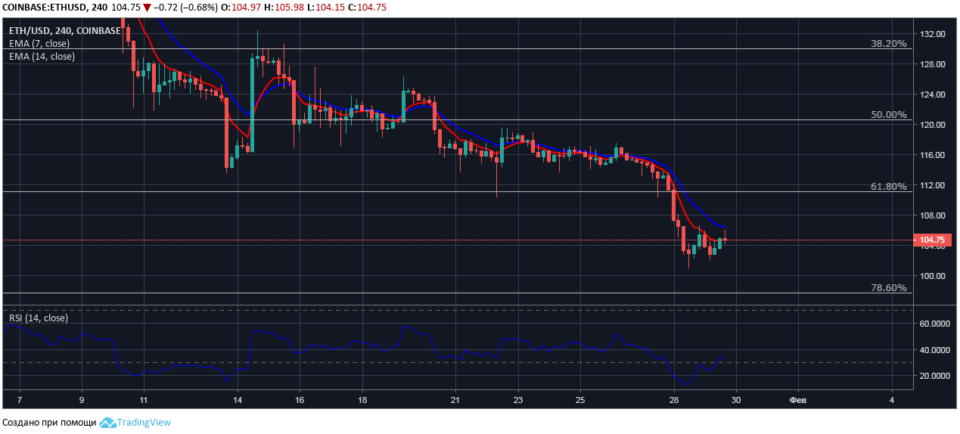
Four hour ETH / USD chart
At the ethereum auction on January 29, the bulls managed to defend their positions above the new January minimum price of $ 100.90. Buyers confirmed the temporary support of cryptocurrency at $ 102.30.
During the day trading, the ETH / USD pair overcame the resistance of sales at the level of the moving average EMA7 with a value of $ 104.70. However, testing the next resistance level at $ 106.00 showed both customer fatigue and high density of cryptocurrency sales applications.

At the time of the review, the ETH / USD pair is priced at $ 104.90 at a weak support level. The value of the relative strength index is in the sales area, the RSI14 line is horizontally directed, with a tendency to turn down to cross the border of the oversold area.
In the short-term, signals to lower quotes of etrium are reinforced by the formation of a bearish divergence and a “double top” pattern with a target level at $ 98.00.
We assume that on January 30, on the ethereum, bears will attempt to break through the local support level of $ 102.30 with further development of the downward movement towards the correction level of 78.6% – $ 98.00.
.