On the markets of major altcoins are consolidating large volumes of purchases of scriptaction. There is a possibility of price growth of the cryptocurrency in the next 48 hours.
XRP/USD
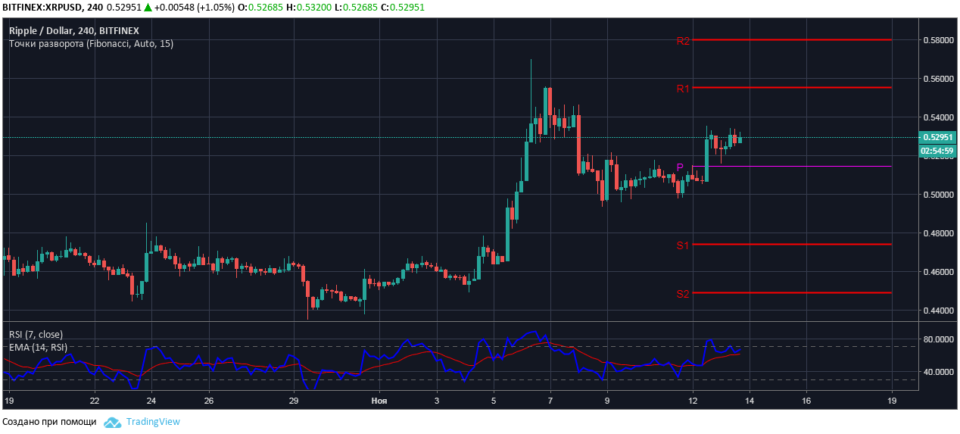
The bulls on the market Ripple November 12, has broken the resistance of $0,5148 at the level of the reversal of the local trend. On the four-hour chart the price formed a model of trend continuation ascending triangle with the upper boundary at $0,5340.
In case of breaking the upper boundary of the figure, the expected growth of quotations XRP/USD on a strong impulse, at least to $0,5554 on the first key level of resistance.

On the chart the relative strength index RSI7 indicator line supported EMA14 moving average, indicating upward trend and Ripple on the dominance of buyers in the market.
Buy Ripple possible at the breakout resistance level of $0,5340 with order $0,5455 and $0,5440.
BCH/USD
From November 10 Bitcoin Cash consistently trading in the range of $510 to $558. It is obvious that the main resistance to the sellers formed at the level of the reversal of $567.

To fork the Bitcoin network, Cash November 15, possible sharp fluctuations of quotations of the pair BCH/USD. Not ruled out the possibility of growth in the value of the session volatility of the cryptocurrency to $200 range from $438 to $646.
Data of RSI7 indicator indicates situational advantage buyers BCH. The value of the indicator in the purchasing area, the RSI line is pointing up.
LTC/USD
C 11 November, the litecoin is trading in a narrow price range from $50,60 to $51,70. At the time of the review of the market the pair LTC/USD is quoted at $51,25.
Current price Aldona is below the level of the reversal of the local trend – $52,80. However, there is a probability of growth of quotations LTC/USD in this session at least to the level of the upper boundary of the range of $51,70.

In the case of the breakdown of local resistance level, the bulls will test the density of the volume of sales on the level of the pivot.
On the probability of growth rates are indicative of litecoin RSI indicator. The value of the indicator in the neutral zone, the RSI line is pointing up to the intersection 50 of the indicator
Short-term buying LTC/USD possible breakout of the level of $51,70 with order $52,10, and $52,90.
Trading recommendations are not a reference to action. Following the recommendations, you assume all associated risk of loss.
.