During the upcoming trading session on 11 December, the bulls again have to defend their positions on critical price level of $3280. In the case of breaking the support bears reached goals of $3000-2700.
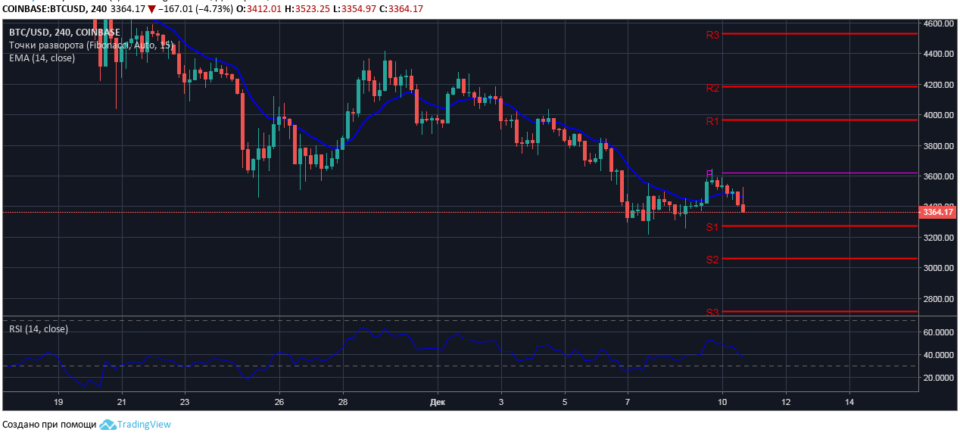
The four-hour chart of BTC/USD
On the four-hour chart of BTC/USD for the current week are calculated, the key levels of support and resistance.:
- the level of a trend reversal – $3620;
- support levels – $3280, $3060, 2720;
- resistance levels– $3970, $4180, $4530.
At the time of market analysis bitcoin to US dollar is quoted at $3360. Unsuccessful attempt of the bulls to overcome resistance at the pivot with the value on the price scale, $3620, confirmed the market which is dominated by bearish sentiment.

The price movement of bitcoin indicates extremely weak support for asset prices in the range of $3620-3330, and the lack of aspirations of investors to risk.
The four-hour chart of BTC/USD it is obvious that to strengthen the position and to reduce the risks of a collapse in the price bulls can only reach the first target at the level of the pivot.
The situation may change if the bulls manage at least to keep the price of pair BTC/USD above the key support level of $3280. The formation of long-term support will help to return to the market for a significant portion of investors.
In turn, the bearish breakout of the support at the key level of $3280, which at this price point and seeks to open bitcoin sellers scope for its reduction in the values area $3000-2700.
.