The price of ethereum in the short term will recover above a weekly pivot of $ 143.00.
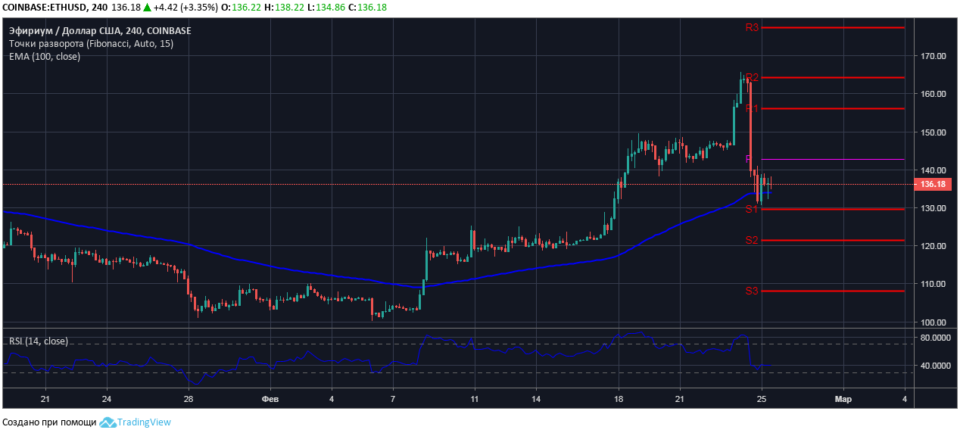
Four hour ETH / USD chart
At the time of the market review, ethereum to the US dollar is quoted at $ 136.18. The morning testing of the price support confirms the readiness of the bulls to buy back large volumes of etherium for sale below the dynamic support level of $ 134.00, which is formed along the EMA100 moving average line.
The current price of the pair ETH / USD is below the weekly pivot with a mark on the price scale of the four-hour chart – $ 143.00. The values of the relative strength index are also, since the collapse, prices are in a bearish area on the indicator chart.

The RSI14 line has turned up from the border with the oversold area, and since the opening of the current session is directed horizontally with a tendency to resume the upward movement, which indicates a slight advantage for buyers in the short-term ETH market.
An analysis of the ETH / USD chart shows that the nearest resistance to the growth of the cryptocurrency price is formed at the local level of $ 139.00. It should be expected that in case of a probable breakdown of sales resistance at the indicated level, the price of ethereum can fix a new session maximum at the level of the reversal of the short-term trend of $ 143.00.
Despite the strong drawdown of the coin price over the past 24 hours, it is recommended to enter the market with short ETH / USD positions only on a confirmed breakdown of the first key support level of $ 129.60.
.